Template previews
Free Slope Calculator Excel Template
You've got two points (maybe from a homework problem, a set of survey coordinates, a ramp you're sketching out, or a chart you're trying to reverse-engineer) and you need more than just "the slope." You need the angle, so you know how steep the line actually looks. You need the distance between the points. You need the equation itself, written in whatever form your next step calls for, because slope-intercept form doesn't help much when the assignment or the spec sheet wants standard form instead.
This Excel workbook is built around one clear job: take two coordinate points and lay out everything a line through them implies: slope, angle, straight-line distance, midpoint, y-intercept, x-intercept, and the equation in three separate forms, with the math left visible in the formulas themselves. What makes it worth opening in Excel instead of just using the free browser-based Slope Calculator it's built on is the extra layer underneath: a settings sheet for angle convention and rounding, a reverse solver for finding a missing x or y, a five-row scenario table for testing alternate points, and a quiet QA panel checking that the equation actually passes back through both points before it tells you the workbook is reliable.
What's Included in the Slope Calculator Workbook
The template ships as a single Excel workbook with three connected sheets.
Settings & Guide
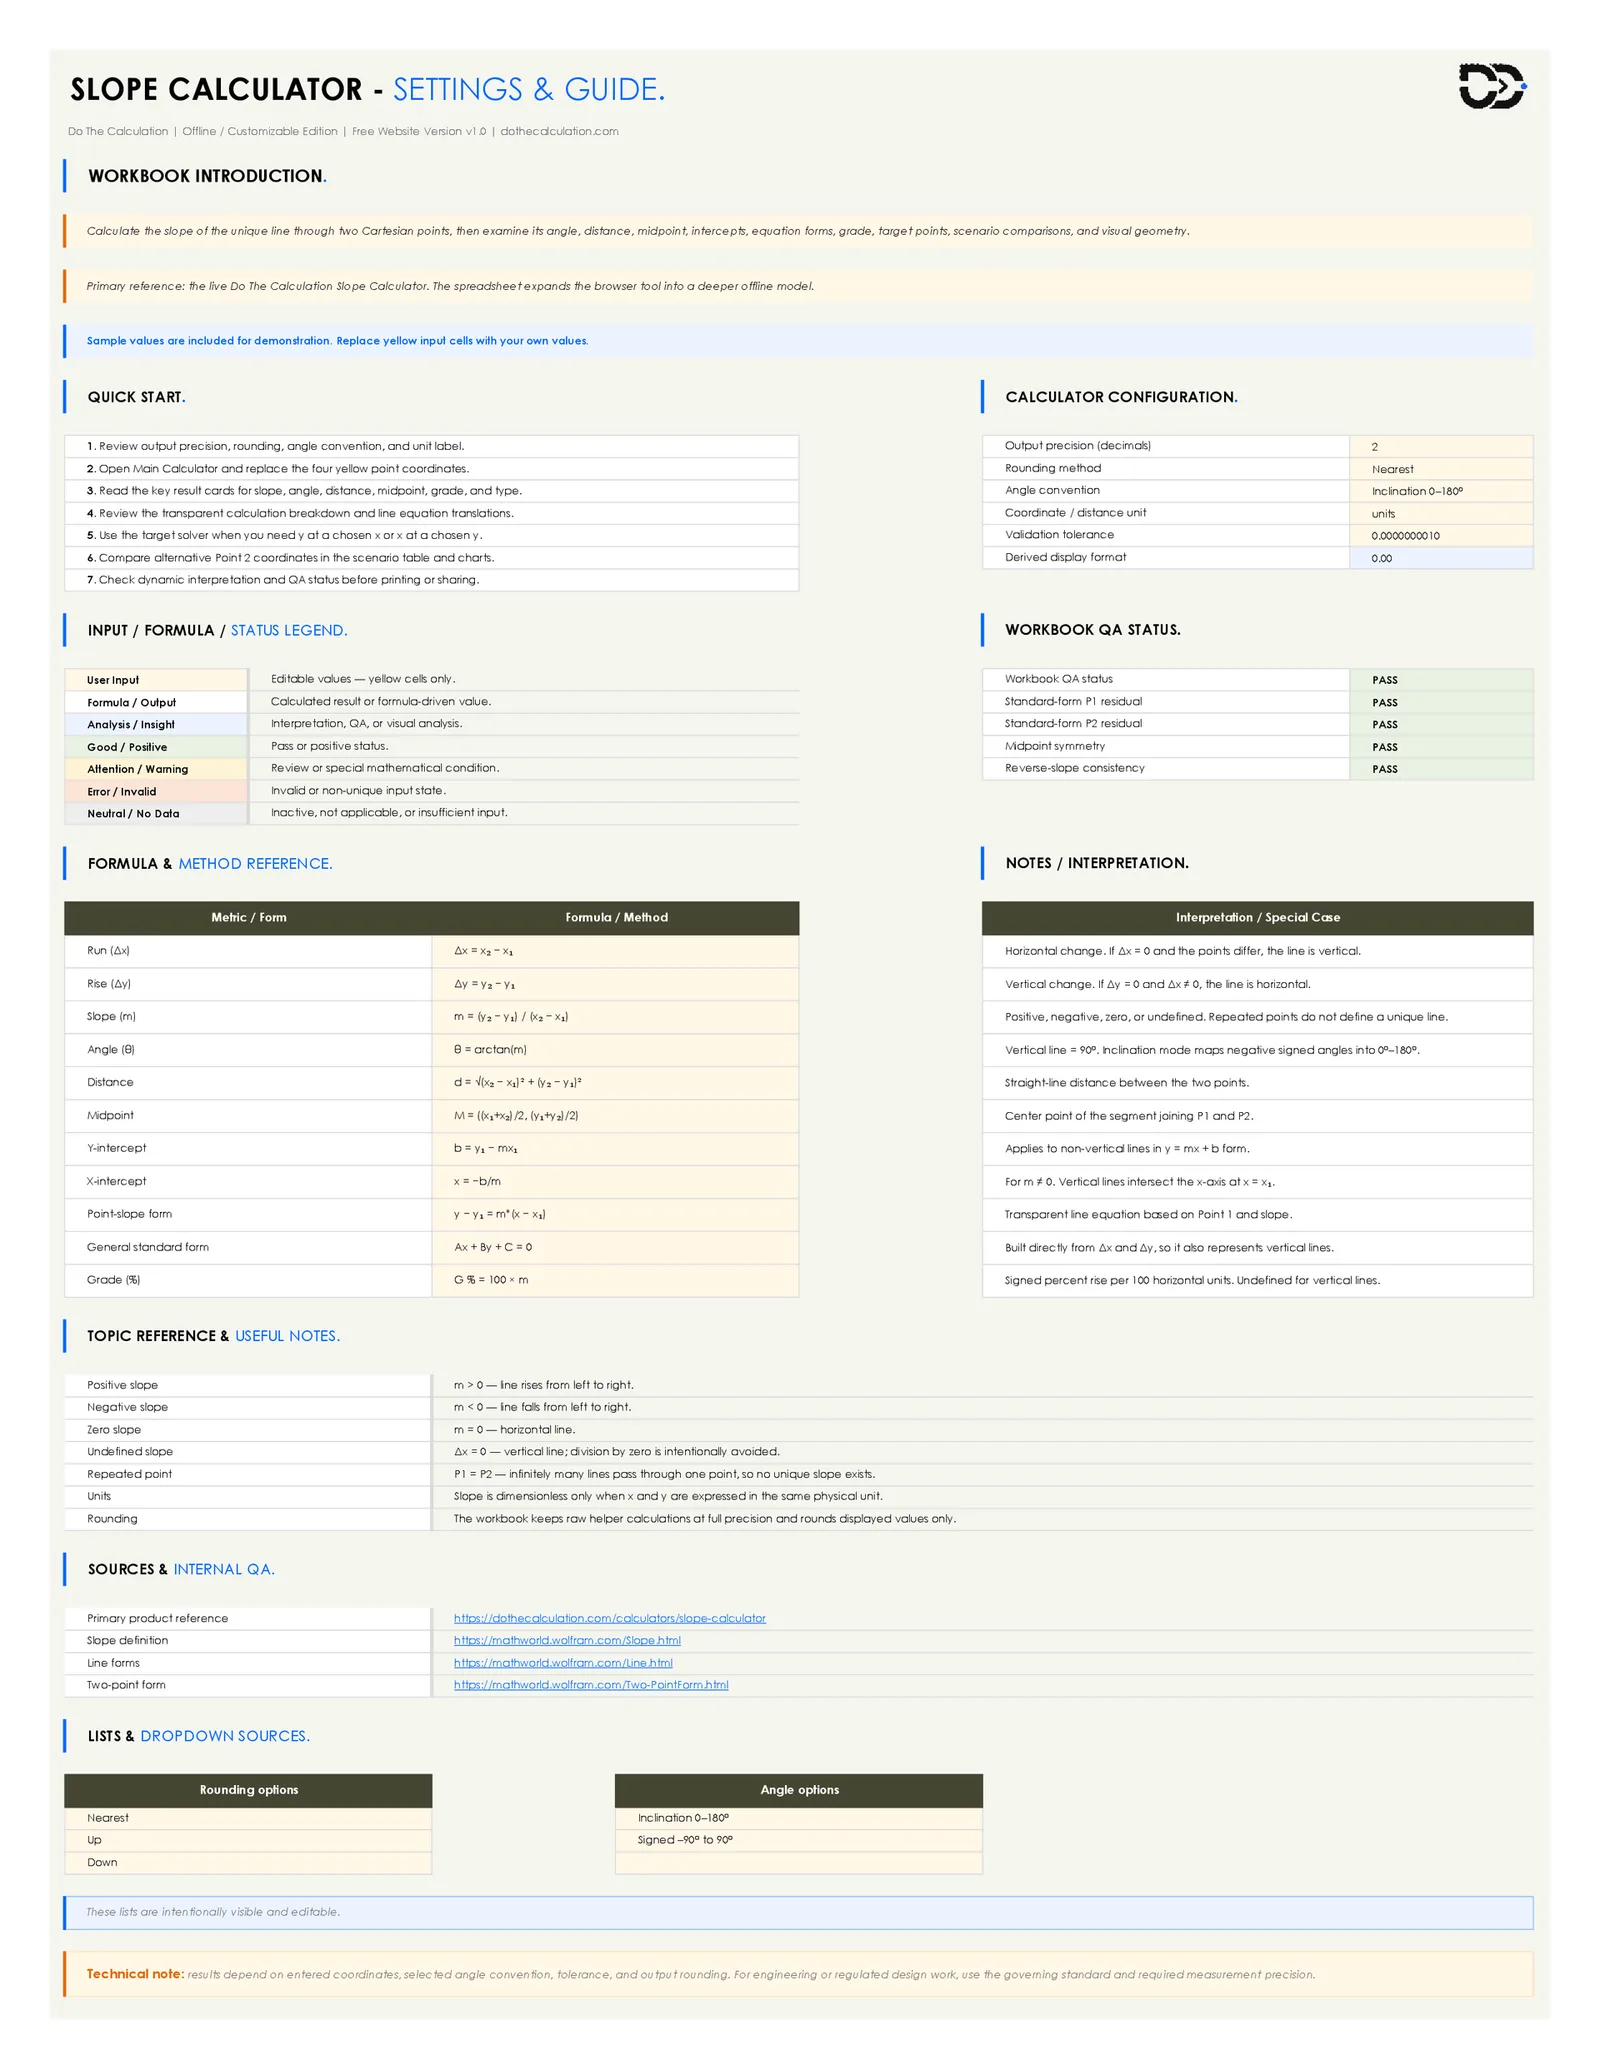
Workbook introduction, a seven-step quick start list, and the Calculator Configuration panel controlling output precision (0–6 decimals), rounding method, angle convention, and the coordinate/distance unit label. Also holds the input/formula/status legend, the Workbook QA Status panel, a full formula & method reference table, a notes/interpretation column for edge cases like vertical and undefined slopes, and the editable Rounding Options and Angle Options dropdown lists.
Main Calculator
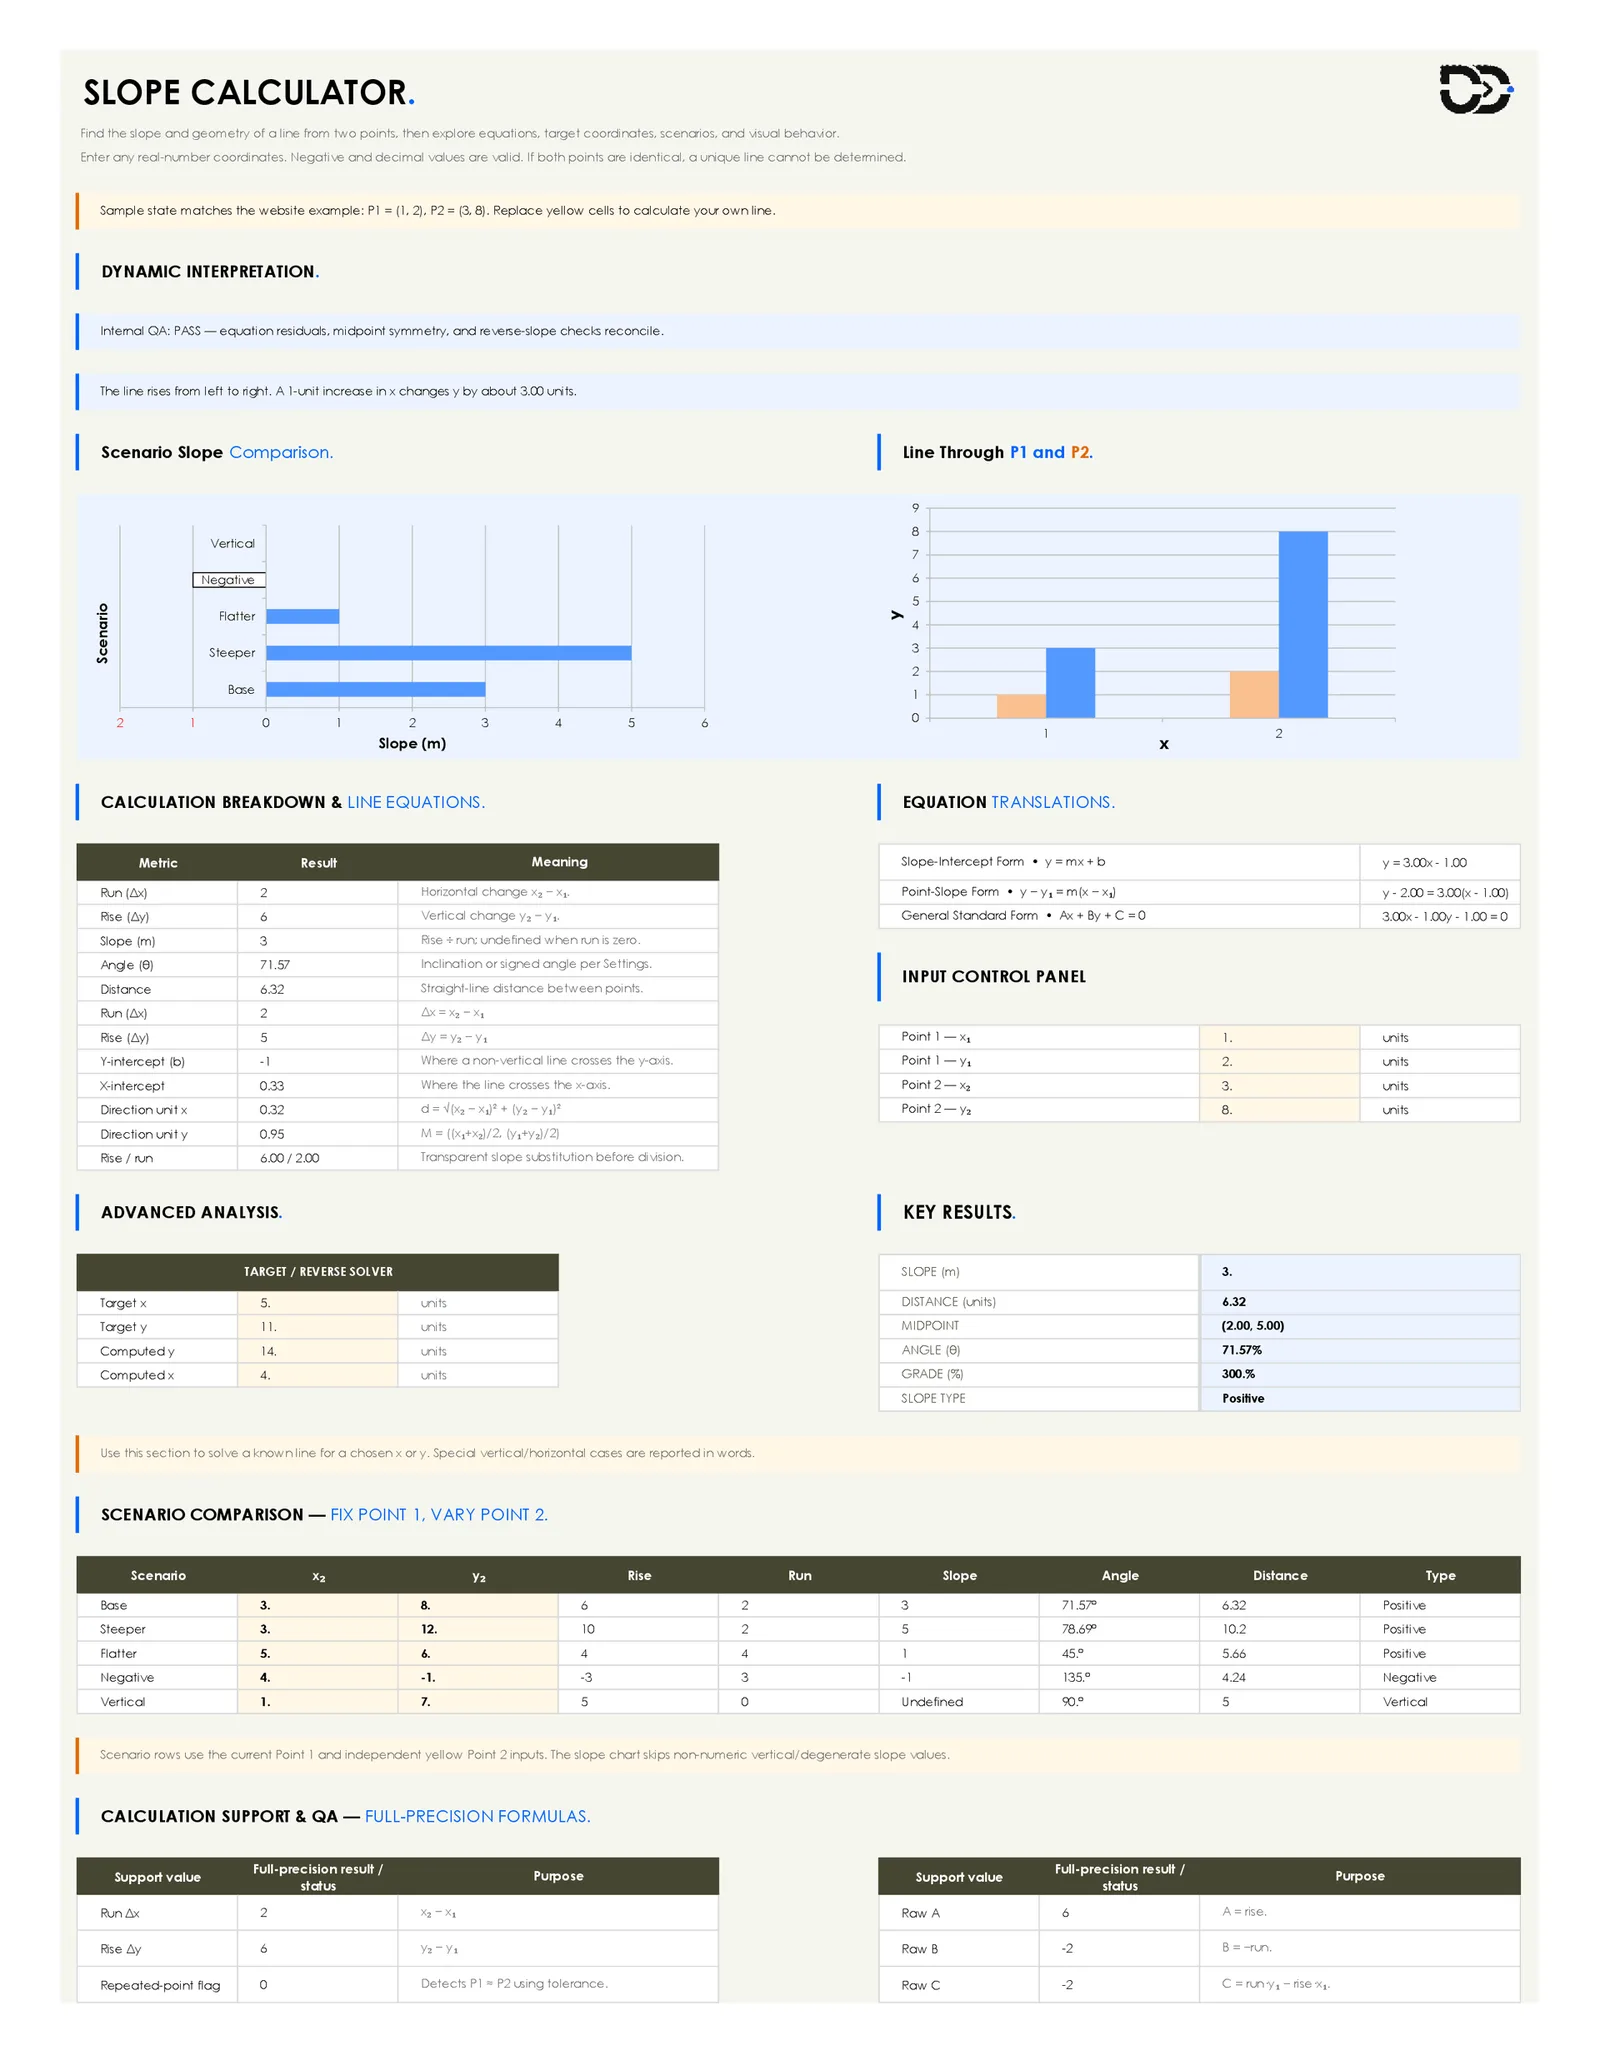
The four yellow input cells (Point 1 and Point 2) in the Input Control Panel, a Dynamic Interpretation strip written in plain language, a Scenario Slope Comparison bar chart and a Line Through P1 and P2 column chart, the Calculation Breakdown & Line Equations table, the Equation Translations panel, the Advanced Analysis / target-reverse solver, a six-item Key Results card, the five-row Scenario Comparison table, and a Calculation Support & QA section exposing the full-precision math behind every displayed number.
About
Template name, version (Free Website Version v1.0), brand, file format (Excel workbook, no VBA/macros), compatibility notes, a disclaimer that the workbook is for general planning and informational purposes, a redistribution note, and the copyright line.
What This Template Helps You Do
Find the slope from any two points, instantly
Type in Point 1 and Point 2 and the workbook calculates rise, run, and slope the moment you finish: no separate calculate button, every downstream result updates live.
See the angle, not just the ratio
The Key Results card converts the slope into an angle of inclination (or a signed angle, depending on your settings), so you get a number you can actually picture.
Read the distance and midpoint together
The straight-line distance and the midpoint of the segment connecting your two points sit right next to the slope, calculated from the same coordinate pairs.
Get the equation in three forms, translated live
The Equation Translations panel writes your specific line in slope-intercept form, point-slope form, and general standard form, with your actual numbers substituted in.
Solve backward with the target/reverse solver
If you already know a target x and need the matching y (or the reverse), the Advanced Analysis section solves it directly from your current line without rearranging the equation by hand.
Compare five alternate scenarios without touching your base line
The Scenario Comparison table keeps Point 1 fixed and tests five different Point 2 values (Base, Steeper, Flatter, Negative, and Vertical), each with its own rise, run, slope, angle, and distance.
Control precision and angle convention from one place
The Settings & Guide sheet holds dropdown-driven controls for output precision, rounding method, and angle convention, so the whole workbook follows one consistent standard.
Trust the result with a visible QA check
The Workbook QA Status panel confirms the standard-form equation satisfies both input points, the midpoint is equidistant from each point, and reversing the point order still produces the same slope: five separate PASS checks.
How to Use the Template
Using the workbook takes eight straightforward steps.
- Open the workbook and read the Settings & Guide sheet first. Skim the Workbook Introduction, Quick Start list, and the color-coded legend (yellow = input, everything else calculated).
- Set your rounding, angle convention, and precision in the Calculator Configuration panel before entering real coordinates, since these settings apply across the whole workbook.
- Enter Point 1 on the Main Calculator sheet. Replace the sample x₁ and y₁ values in the Input Control Panel with your own (sample state ships as P1 = (1, 2)).
- Enter Point 2 the same way. The moment both points are filled in, the Key Results card, the equation panel, and both charts update automatically.
- Read the Key Results card: slope, distance, midpoint, angle, grade percentage, and slope type in one place, before digging into the detail tables.
- Review the Calculation Breakdown and equation translations: every intermediate value (run, rise, intercepts, direction vectors) with a plain-language meaning, plus your line written in all three equation forms.
- Use the Target/Reverse Solver if you need a specific x or y. Enter a target x to get the matching y, or a target y to get the matching x, based on the line you just defined.
- Compare alternate points and confirm the QA status before you rely on the result. Use the yellow cells in the Scenario Comparison table, then check that the Workbook QA Status panel reads PASS.
Practical Example
Say you're working with two points, (1, 2) and (3, 8), which happens to be the sample data the workbook ships with, so you can follow along in the actual file.
What you enter: Point 1 (x₁ = 1, y₁ = 2). Point 2 (x₂ = 3, y₂ = 8).
What the workbook calculates: Run (Δx) = 2, Rise (Δy) = 6, Slope (m) = 3, Angle (θ) = 71.57° (Inclination 0–180° setting), Distance = 6.32 units, Midpoint = (2.00, 5.00), Grade = 300%, Slope type = Positive.
What it writes out for you: Slope-intercept form y = 3.00x − 1.00, point-slope form y − 2.00 = 3.00(x − 1.00), and general standard form 3.00x − 1.00y − 1.00 = 0.
Rather than stopping at "the slope is 3," you can see that this line climbs steeply (71.57°, closer to vertical than horizontal), that the two points sit about 6.32 units apart, and that the y-intercept is −1, all pulled from the same two numbers you typed in. If you then wanted to know where this line sits at x = 5, the Target/Reverse Solver answers that directly (in the workbook's own sample state, targeting x = 5 returns y = 14, and targeting y = 11 returns x = 4) without rearranging y = 3x − 1 by hand.
This example shows how the workbook's sections connect, not financial, engineering, or professional guidance. For anything going into a regulated design or construction context, use the governing standard and required measurement precision, as the workbook's own technical note also advises.
Understand the Key Results and Reports
Key Results card
Six numbers in one place: slope, distance, midpoint, angle, grade percentage, and slope type, the first thing to check after entering your points.
Dynamic Interpretation strip
A plain-language sentence above the charts: for the sample data, "The line rises from left to right. A 1-unit increase in x changes y by about 3.00 units."
Scenario Slope Comparison chart
A horizontal bar chart plotting the slope value for each of the five scenario rows, skipping non-numeric or degenerate slopes like the Vertical row.
Line Through P1 and P2 chart
A simple column chart plotting your two actual points for a visual read on the line alongside the numeric results.
Calculation Breakdown & Line Equations table
Every intermediate step (run, rise, slope, angle, distance, intercepts, direction unit vectors) with a plain-language meaning next to each value.
Equation Translations
Your specific line written in all three standard forms with your actual coefficients substituted in.
Scenario Comparison table
Five rows (Base, Steeper, Flatter, Negative, Vertical), each with its own x₂, y₂, rise, run, slope, angle, distance, and type.
Calculation Support & QA panel
The full, unrounded precision behind every number, the raw standard-form coefficients (A, B, C), the P1 and P2 residual checks, a midpoint symmetry check, a reverse-slope consistency check, and a single Overall QA cell reading PASS or FAIL.
Who This Template Is Best For
Students learning coordinate geometry
Seeing all three equation forms generated from the same two points makes it easier to see how slope-intercept, point-slope, and standard form relate, instead of memorizing them separately.
Teachers building practice problems
The Scenario Comparison table makes it fast to generate a set of related examples (steeper, flatter, negative, vertical) from one base line.
Freelancers and analysts who want to show their work
Every intermediate value is a visible formula and the QA panel exposes the full-precision math, so this is a reasonable fit for handing a client a calculation they can verify.
Anyone comparing line-equation forms
If you regularly convert between slope-intercept, point-slope, and standard form, having a workbook translate all three from the same input saves manual algebra.
People who want a transparent, auditable spreadsheet
The residual checks and reverse-slope consistency test are a genuine way to catch a typo in your input before you rely on the result.
Excel users who prefer to see the formulas
Nothing is hidden behind VBA or a compiled add-in. Every cell can be clicked and inspected.
Who This Template May Not Be For
- Anyone doing regulated or engineering-grade design work: the workbook's own technical note is direct that results depend on entered coordinates, angle convention, tolerance, and rounding, and for regulated design work you should use the governing standard and required precision instead.
- Users who need to process many lines or points at once: this is a single-line calculator built around one Point 1 and one Point 2 plus five scenario rows, not bulk coordinate lists or batch imports.
- Anyone who needs a native, dedicated Google Sheets build: the workbook opens in Google Sheets with reasonable fidelity, but it was built and tested in Excel first.
- Users who want VBA-driven automation: there are no macros in this workbook by design; every result is a plain formula.
- Anyone who needs 3D or vector-based line math: everything here is two-dimensional coordinate geometry, x and y only.
Why This Template Is Different
A blank spreadsheet with a slope formula in one cell answers one question. This workbook is built to answer the next five questions that usually follow it. Instead of a single output, you get the angle, the distance, the midpoint, and the equation in three forms, generated from the same two inputs, with a settings sheet controlling how the whole thing rounds and reports angles, so you set your preferences once instead of adjusting individual formulas.
The reverse solver means you're not limited to "given two points, find the line." You can also go the other direction: given the line and a target x or y, find the missing coordinate. The scenario table means you can test alternate versions of Point 2 without losing your original numbers or duplicating the whole sheet.
The part most free templates skip entirely is the QA layer. The Calculation Support & QA section doesn't just show a rounded answer. It shows the full-precision math behind it, the raw standard-form coefficients before simplification, and a set of residual and consistency checks that confirm the math actually holds together.
Practical Tips Before You Start
- Enter x before y for each point: the Input Control Panel is laid out x₁, y₁, x₂, y₂ in that order, and mixing them up will give you a mirrored (and wrong) line.
- Decide on your angle convention (Inclination 0–180° vs Signed −90° to 90°) before comparing results to a printed diagram or another tool: the same line reports a different angle number depending on which convention is selected.
- Use decimals where your actual data has them; the workbook doesn't need whole numbers and rounds only for display, keeping the underlying math at full precision.
- Check the Overall QA cell (or the Workbook QA Status panel) after entering new points, especially if you've edited anything else on the sheet.
- Use the Scenario Comparison table to explore "steeper" or "flatter" alternatives instead of overwriting your original Point 1/Point 2 inputs.
- Keep a backup copy of the file before making structural edits: adding rows or deleting columns near the formula areas can break references.
- Don't delete or edit the Rounding Options and Angle Options lists on the Settings sheet; the dropdowns on that sheet depend on them.
Common Mistakes to Avoid
- Swapping x and y when entering a point: the workbook can't tell a genuine coordinate from a swapped one; it'll calculate a real but wrong line, so double-check each pair before reading the results.
- Entering the same point twice: if Point 1 and Point 2 are identical, there's no unique line, and the repeated-point flag will reflect that; treat it as a signal to recheck your inputs, not a bug.
- Typing over a formula cell instead of a yellow input cell: only the four coordinate cells and the settings dropdowns are meant to be edited.
- Ignoring the angle convention setting: comparing an Inclination-mode angle to a Signed-mode angle from another source looks like a discrepancy that isn't actually there.
- Assuming Google Sheets will render everything identically: charts, dropdown validation, or conditional formatting can behave slightly differently outside Excel.
- Reading the grade percentage as an angle: Grade (%) is 100 × slope, not the angle in degrees; a 300% grade and a 71.57° angle describe the same line but are not the same number.
What You Get in the Download
This template downloads as a single ready-to-use Excel workbook (.xlsx), with no ZIP folder to extract. Open it and the sample points (1, 2) and (3, 8) are already filled in, so you can see the full calculation working before you replace them with your own coordinates.
Limitations and Honest Notes
- This template provides general slope and line-geometry calculations for planning and learning purposes. It is not financial, legal, tax, engineering, or other professional advice.
- The workbook does not use VBA or macros; every result is a standard Excel formula.
- It's built and tested in Excel. It opens in Google Sheets with reasonable fidelity, but isn't a dedicated Sheets product, and some formatting or dropdown behavior may differ.
- All input is manual: there's no batch import for lists of coordinates or multiple lines at once.
- Formulas can break if input or calculation cells are overwritten with plain text or values; keep a backup copy before heavy edits.
- The workbook rounds only the displayed values; internal calculations run at full precision, which is why the Calculation Support & QA section can show slightly more decimal detail than the main results cards.
- For engineering, construction, or other regulated design work, use the governing standard and required measurement precision rather than relying on this general-purpose calculator.
Frequently Asked Questions
Is this Slope Calculator template really free?
Yes. It's available as a free download directly from Do The Calculation, with no account or payment required.
Does it work in Excel?
Yes, it's built and tested as a standard Microsoft Excel workbook (.xlsx), with no macros or add-ins required.
Will it work in Google Sheets?
It opens with reasonable fidelity in Google Sheets, since it uses standard formulas and dropdown-based data validation rather than VBA. It wasn't built as a dedicated Sheets product, though, so double-check chart and dropdown formatting after uploading if that matters for your use.
Does the workbook use macros or VBA?
No. Every calculated value is a standard Excel formula, so you can click into any cell and see exactly how the result was produced.
Can I change the rounding, settings, or angle convention?
Yes. The Settings & Guide sheet has editable dropdowns for rounding method (Nearest, Up, Down) and angle convention (Inclination 0–180° or Signed −90° to 90°), plus fields for output precision and the coordinate/distance unit label.
Can I print or save a summary of my results?
The Key Results card and Calculation Breakdown table on the Main Calculator sheet are designed to be readable as a one-screen summary, and you can print or export that sheet directly from Excel like any other worksheet.
Does it track or log multiple lines over time?
No, this version calculates one base line (Point 1 to Point 2) plus five preset comparison scenarios. It isn't built for logging a running history of many separate lines.
Is there a dashboard?
Yes, in the sense that the Main Calculator sheet's Key Results card, Dynamic Interpretation strip, and two charts (Scenario Slope Comparison and Line Through P1 and P2) function together as an at-a-glance summary of your inputs.
Is this suitable for beginners?
Yes. The Settings & Guide sheet's Quick Start list and Formula & Method Reference table are written to walk a first-time user through the workbook without assuming prior Excel or geometry experience.
Is this financial, legal, or engineering advice?
No. It's a general planning and calculation tool. The workbook's own About sheet and technical notes are explicit that it isn't a substitute for professional or regulated design guidance.
Can I reuse the file for multiple projects?
Yes, you can duplicate the file or clear the four input cells and re-enter new coordinates as many times as you like. The one restriction is on redistribution: the file itself shouldn't be resold or redistributed.
Can I change the unit label shown next to the coordinates?
Yes, the Coordinate / Distance Unit field on the Settings sheet is an editable text label. Changing it doesn't convert units; it only changes how the label reads.
What happens if I enter the same point twice?
The workbook flags it: a repeated Point 1 and Point 2 means there's no unique line through them, and the repeated-point check in the Calculation Support & QA section registers that instead of returning a false slope value.
What if a formula breaks or shows an error?
Close the file without saving and reopen your backup copy, then re-enter your coordinates in the four yellow input cells only. Avoid typing over any of the calculated cells, tables, or the dropdown lists on the Settings sheet.