Template previews
Free Business Budget Planner Excel Template
Most business budget spreadsheets fall apart the moment actual transactions start coming in. You build a clean list of planned expenses in January, and by March you're either abandoning the sheet or bolting on a second tab to track what actually got spent, with no easy way to line the two up by department, let alone by month.
The Business Budget Planner is built around that specific gap. Instead of one flat list of numbers, it separates planning from actuals from the start: a Budget Plan sheet where you set monthly revenue and expense targets by department and cost center, an Actuals Log where you record real transactions as they happen, and a Budget vs Actual sheet that automatically lines the two up and calculates the variance, in dollars and as a percentage, for every month and every department.
What makes this practical rather than just organized is that the workbook is prewired for it. The moment you log a transaction in the Actuals Log with a matching department, cost center, and line item, it feeds into the Budget vs Actual variance table, the Dashboard's KPI cards and charts, and the Print Summary report, without you touching a single formula. You set up your departments and cost centers once, in the Settings sheet, and the rest of the workbook reads from that list through built-in dropdowns.
This version ships with a fictional company ("Northstar Advisory Studio") and a full year of example numbers so you can see exactly how the formulas, charts, and status flags behave before you clear the data and enter your own. It's built in standard Excel (no macros, no VBA), so it opens and edits the same way any other spreadsheet does.
What This Template Helps You Do
- Plan revenue and expenses by department. The Budget Plan sheet lets you set a monthly target for every revenue and expense line, organized by department (Sales & Marketing, Operations, Finance & Admin, People & HR, Technology, Facilities) and a specific cost center code within it.
- Track spending against a defined cost center structure. Each line item is tied to a cost center code (like MKT-ADV for advertising or HR-SAL for salaries), set up once in Settings, so a transaction logged under OPS-CON always rolls up to Operations consistently.
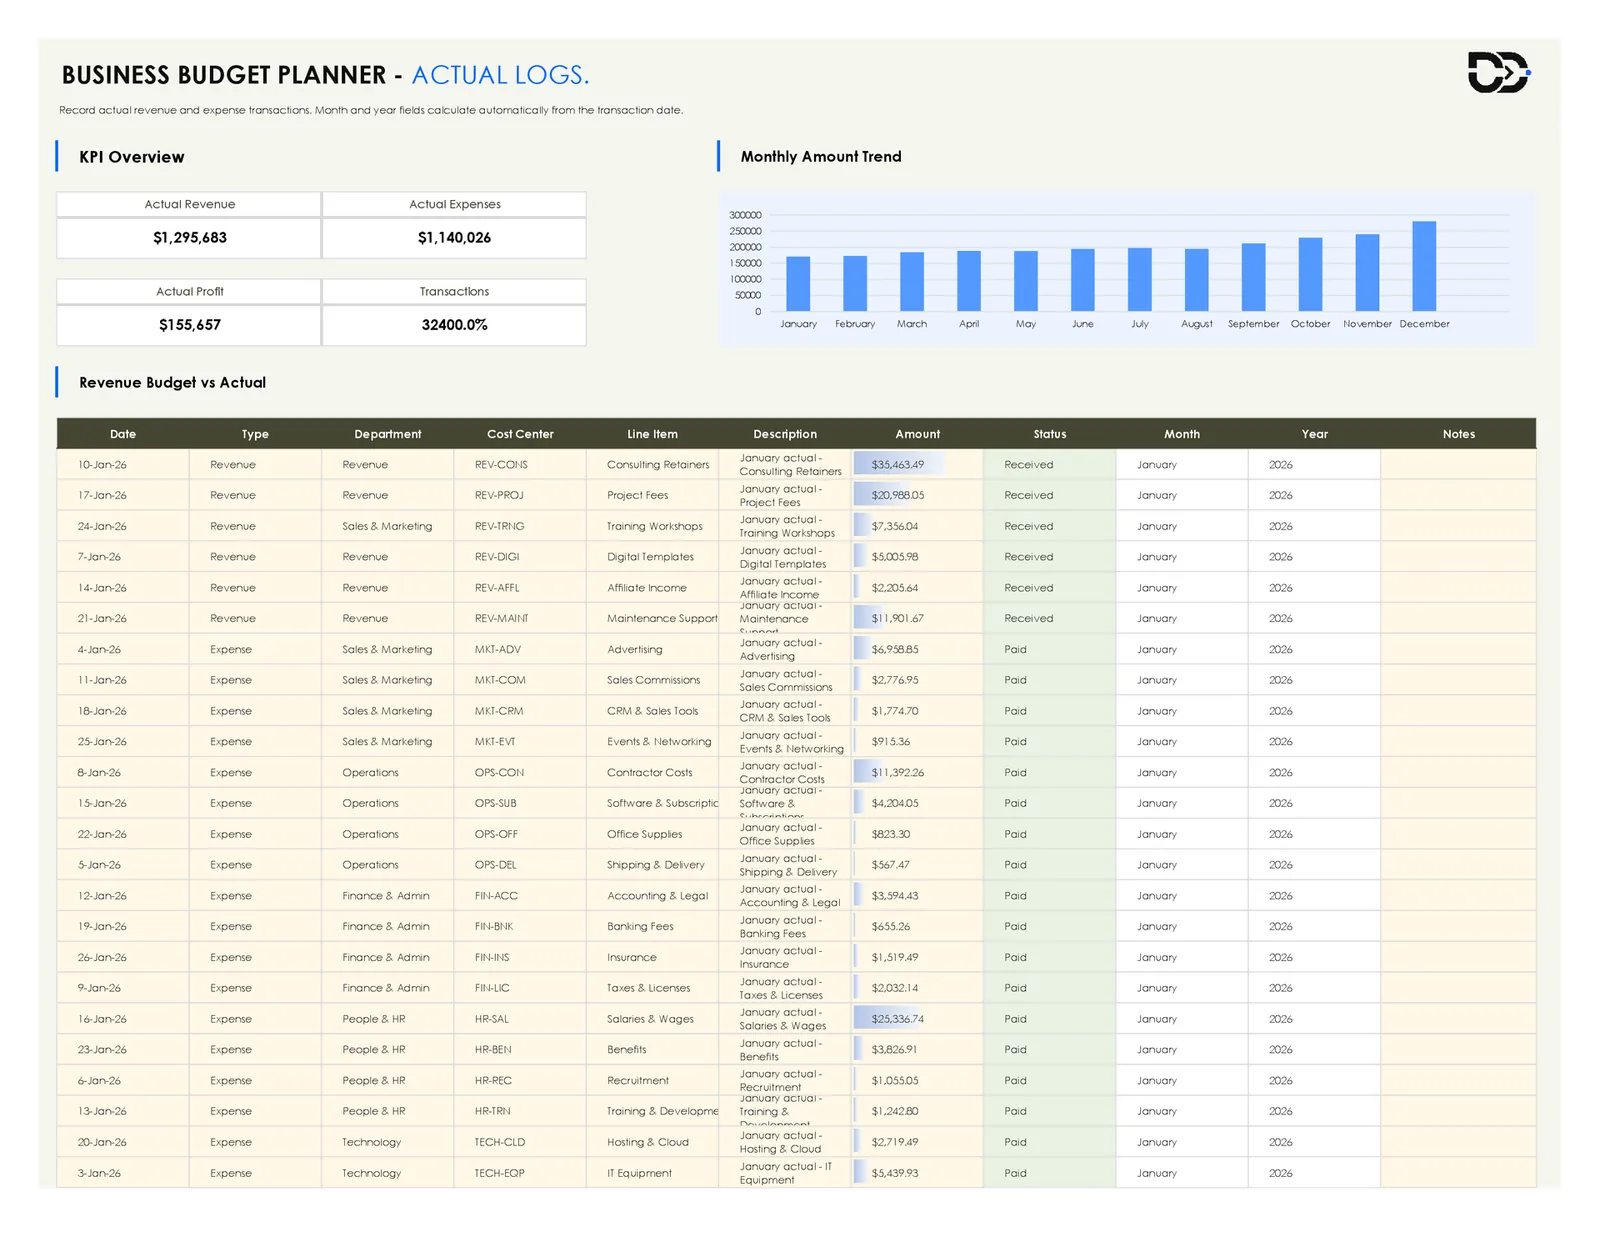
- Log actual transactions as they happen: The Actuals Log gives you a dated transaction record (date, department, cost center, line item, description, amount, and payment status) instead of a single monthly total, with Month and Year calculated automatically from the date.
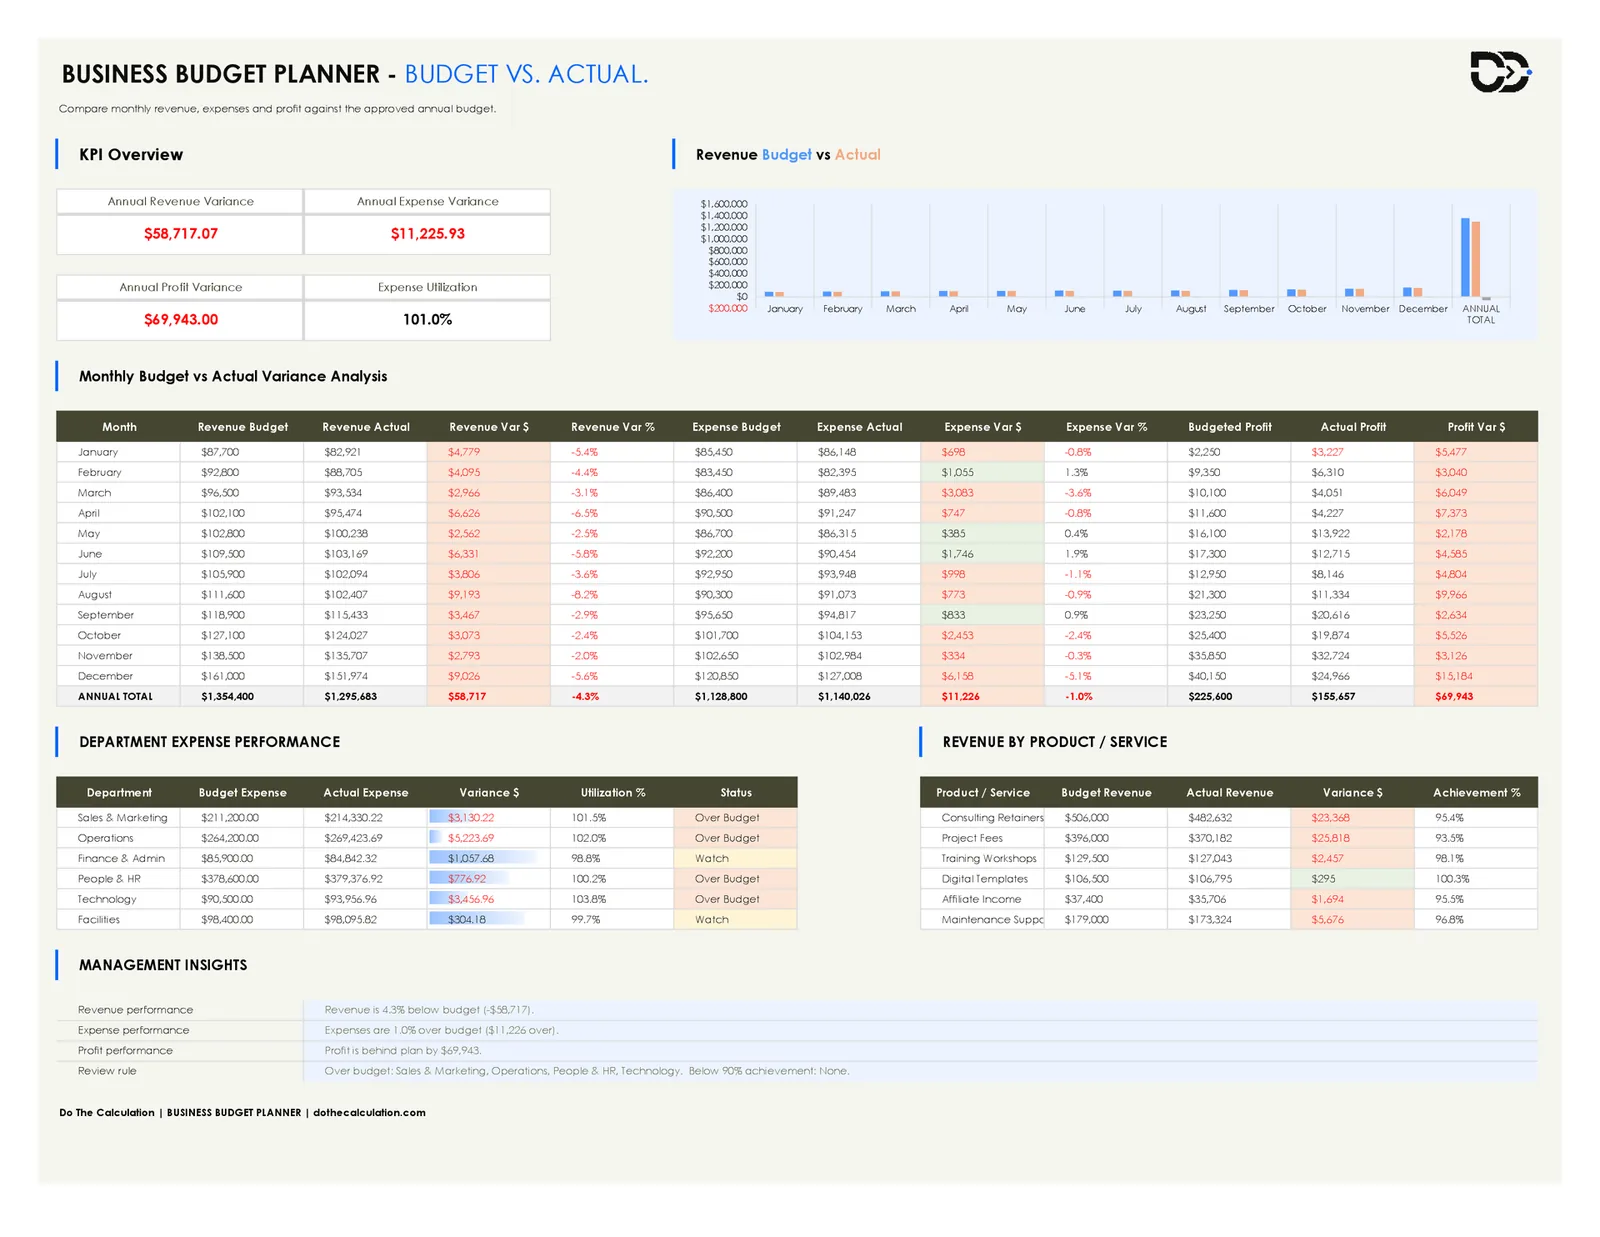
- See budget vs. actual variance without building formulas. The Budget vs Actual sheet compares planned and actual numbers for every month automatically, showing variance in both dollar amount and percentage for revenue, expenses, and profit, plus a status flag per department.
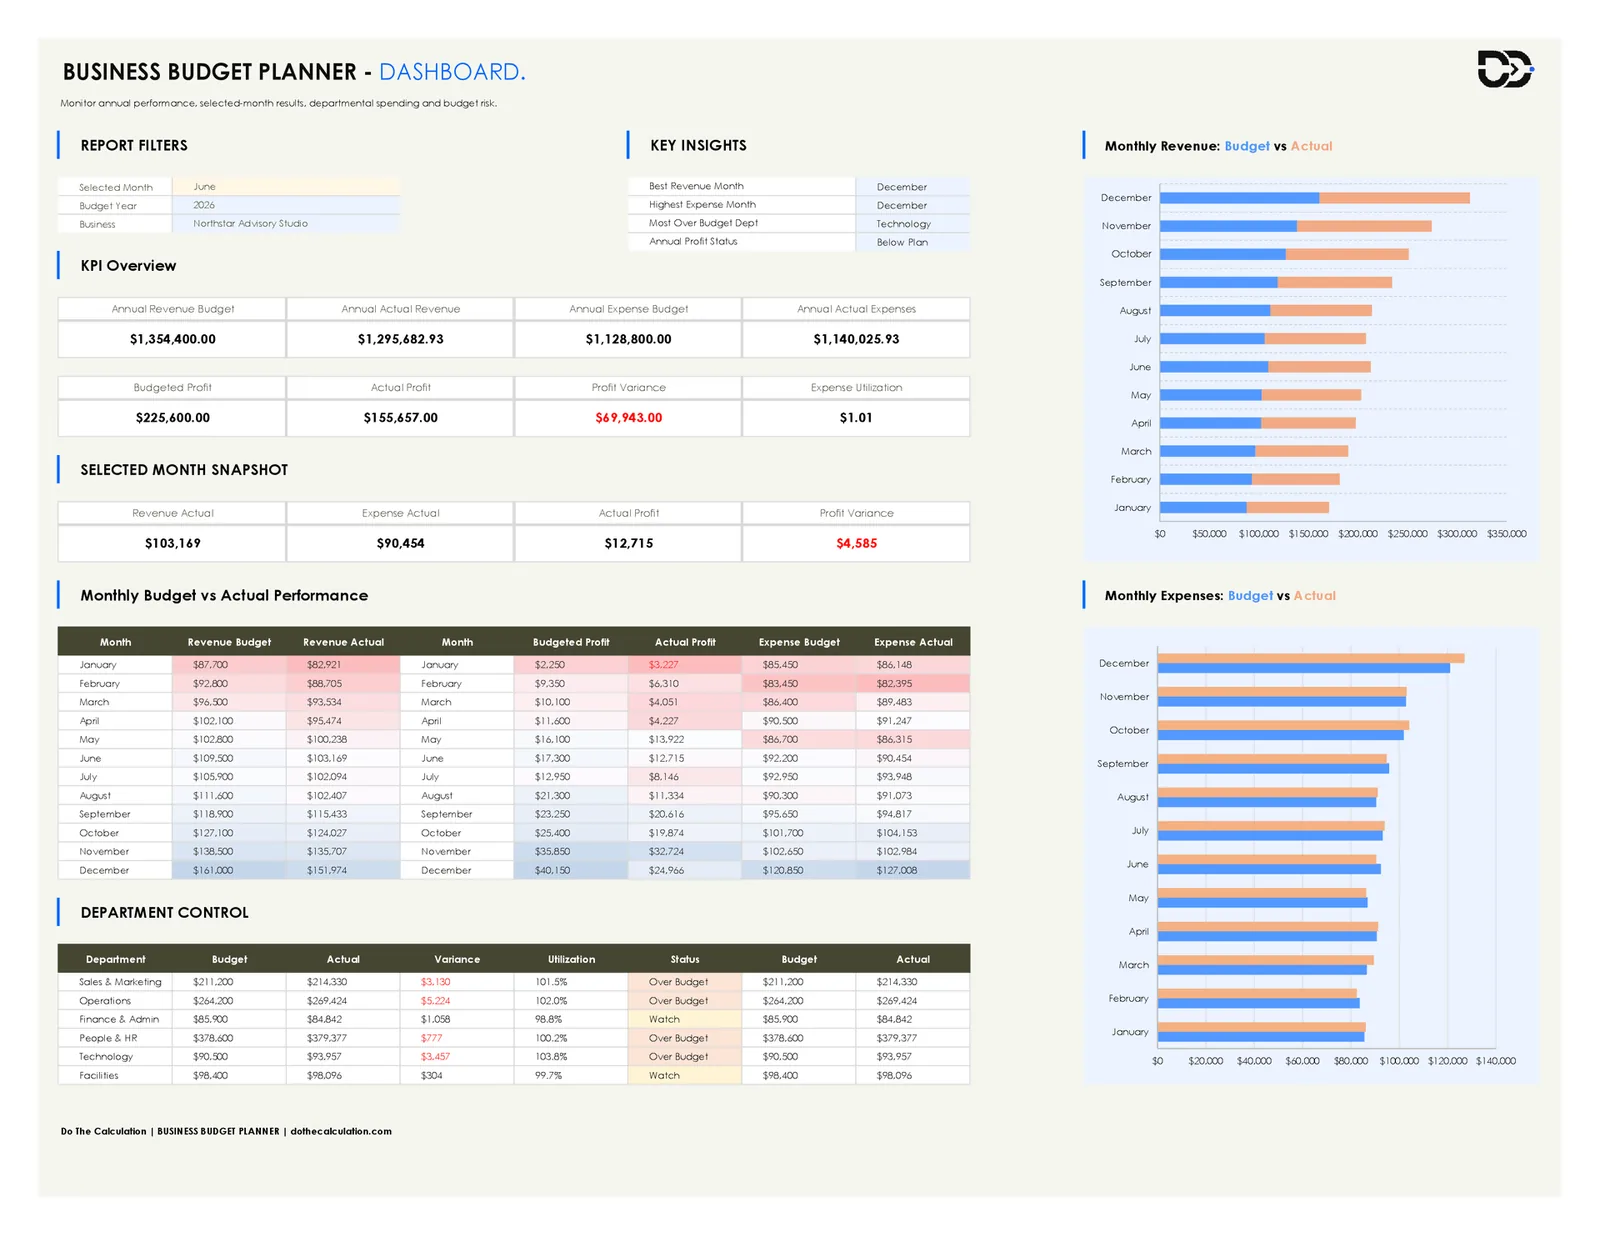
- Review performance on a single dashboard. The Dashboard pulls the year's numbers into one view: annual budget vs. actual, a month-picker snapshot, department-level status flags, and two trend charts comparing budget to actual by month.
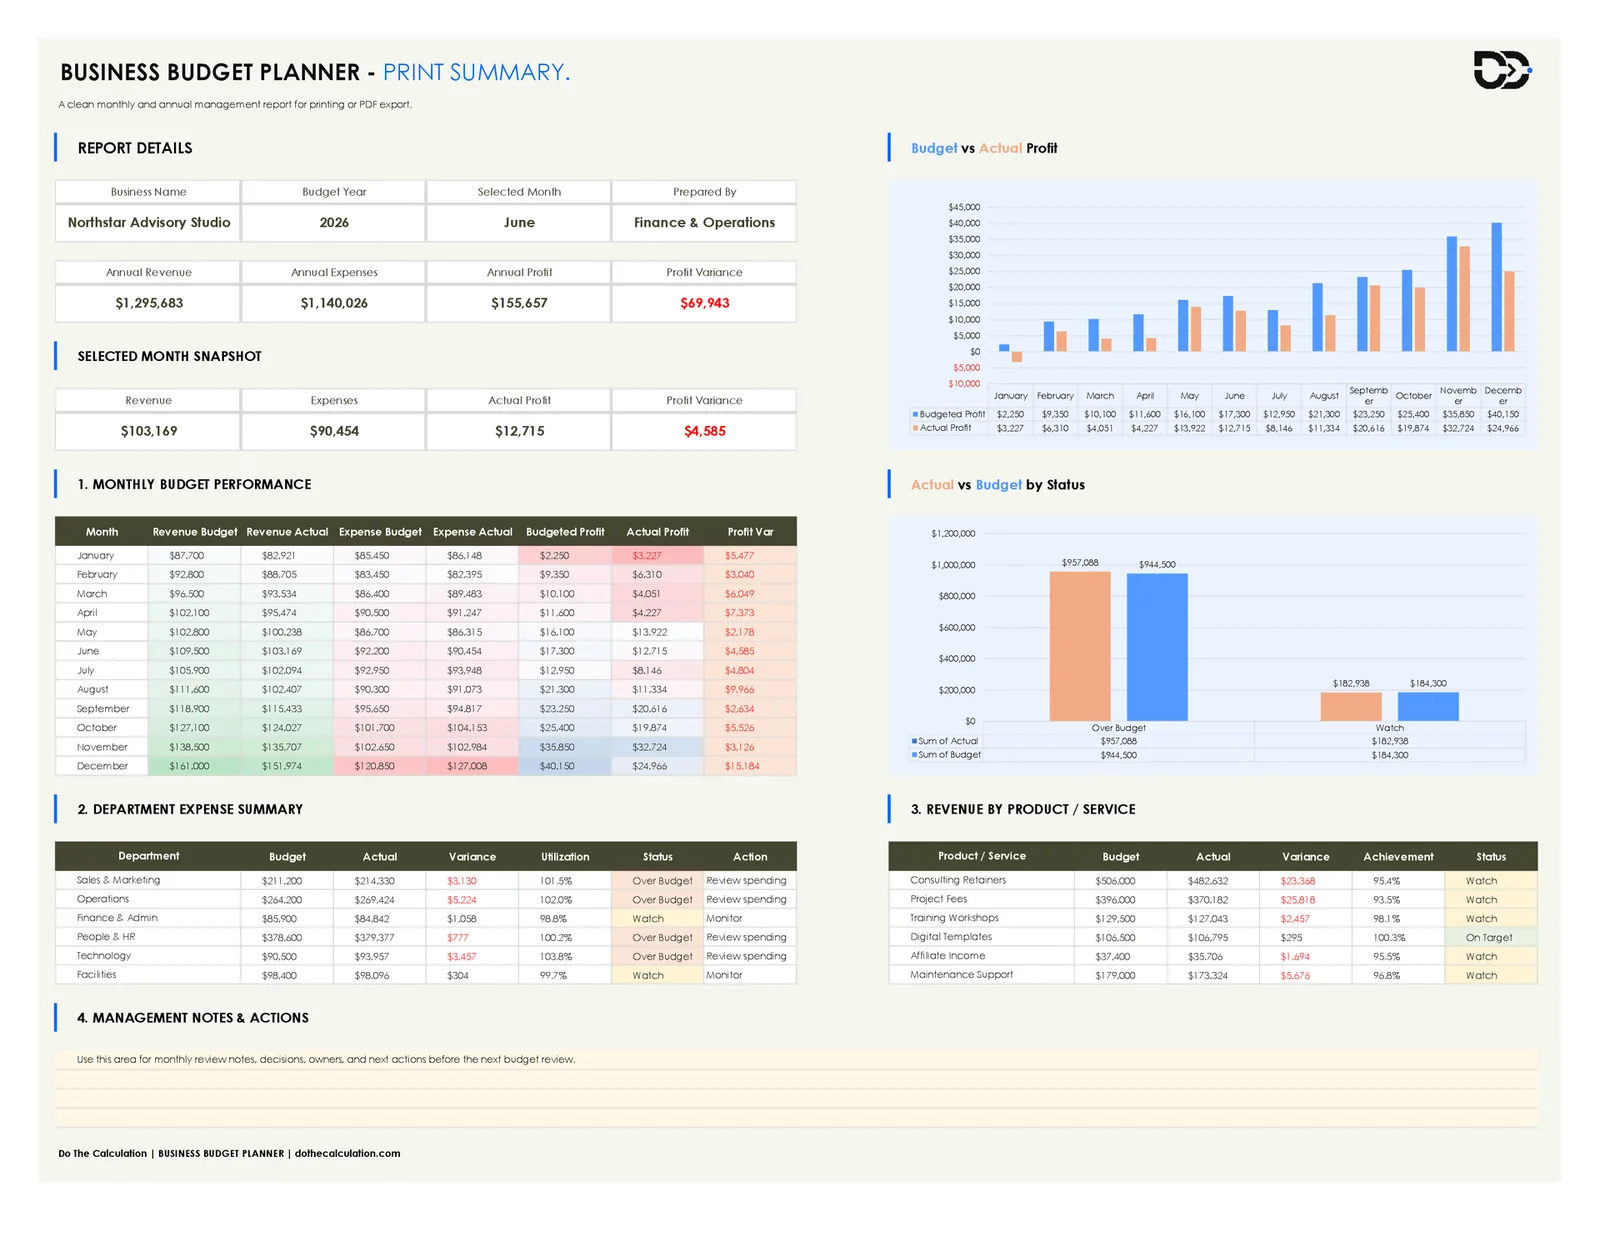
- Generate a clean report for reviews. The Print Summary sheet formats the same underlying data into a report layout, designed to be printed or exported as a PDF for a monthly management review.
- Adjust the structure to your own business. Departments, cost centers, line items, months, years, payment statuses, and budget priority tags are all editable lists on the Settings sheet, and the dropdowns throughout the workbook update as you edit them.
What's Included in the Workbook
The workbook is organized around nine sheets, moving from setup through planning, actuals, analysis, and reporting:
1. Cover
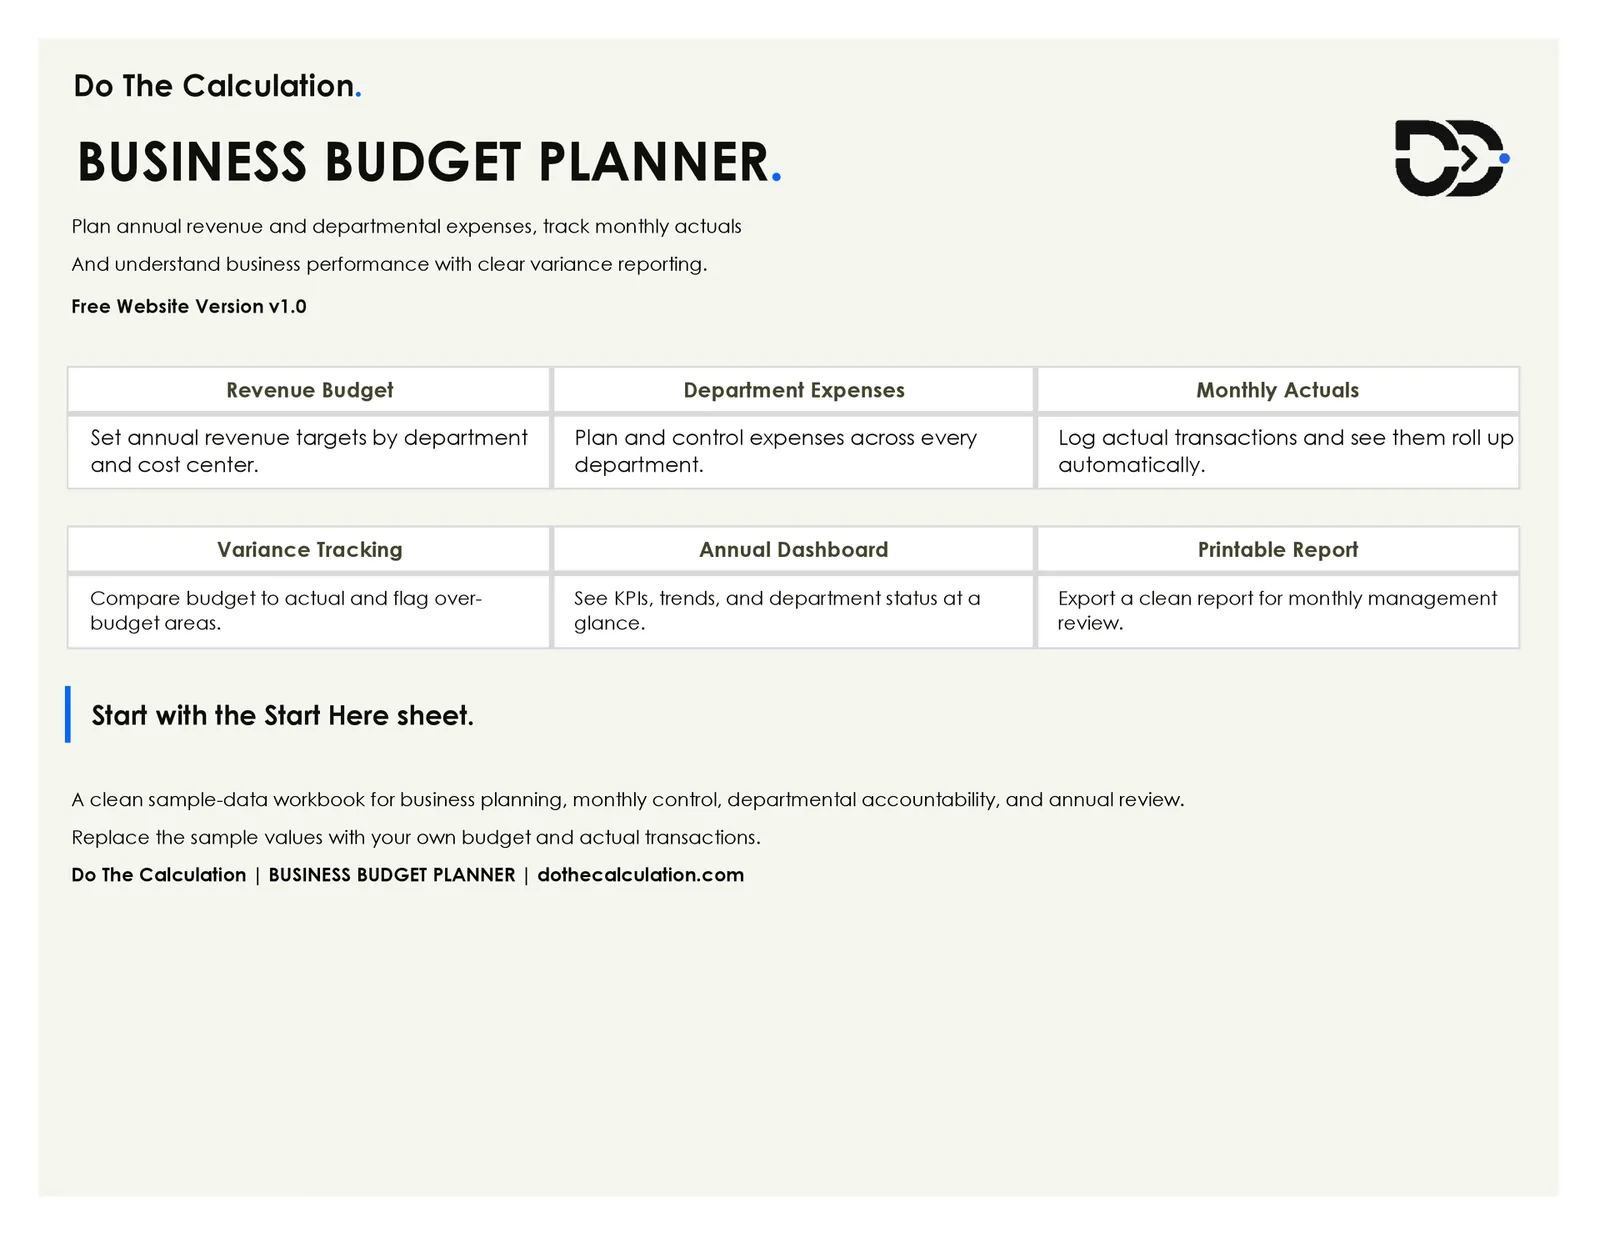
The title sheet: template name, a one-line description, and a six-feature grid (Revenue Budget, Department Expenses, Monthly Actuals, Variance Tracking, Annual Dashboard, Printable Report). Reference only.
2. Start Here
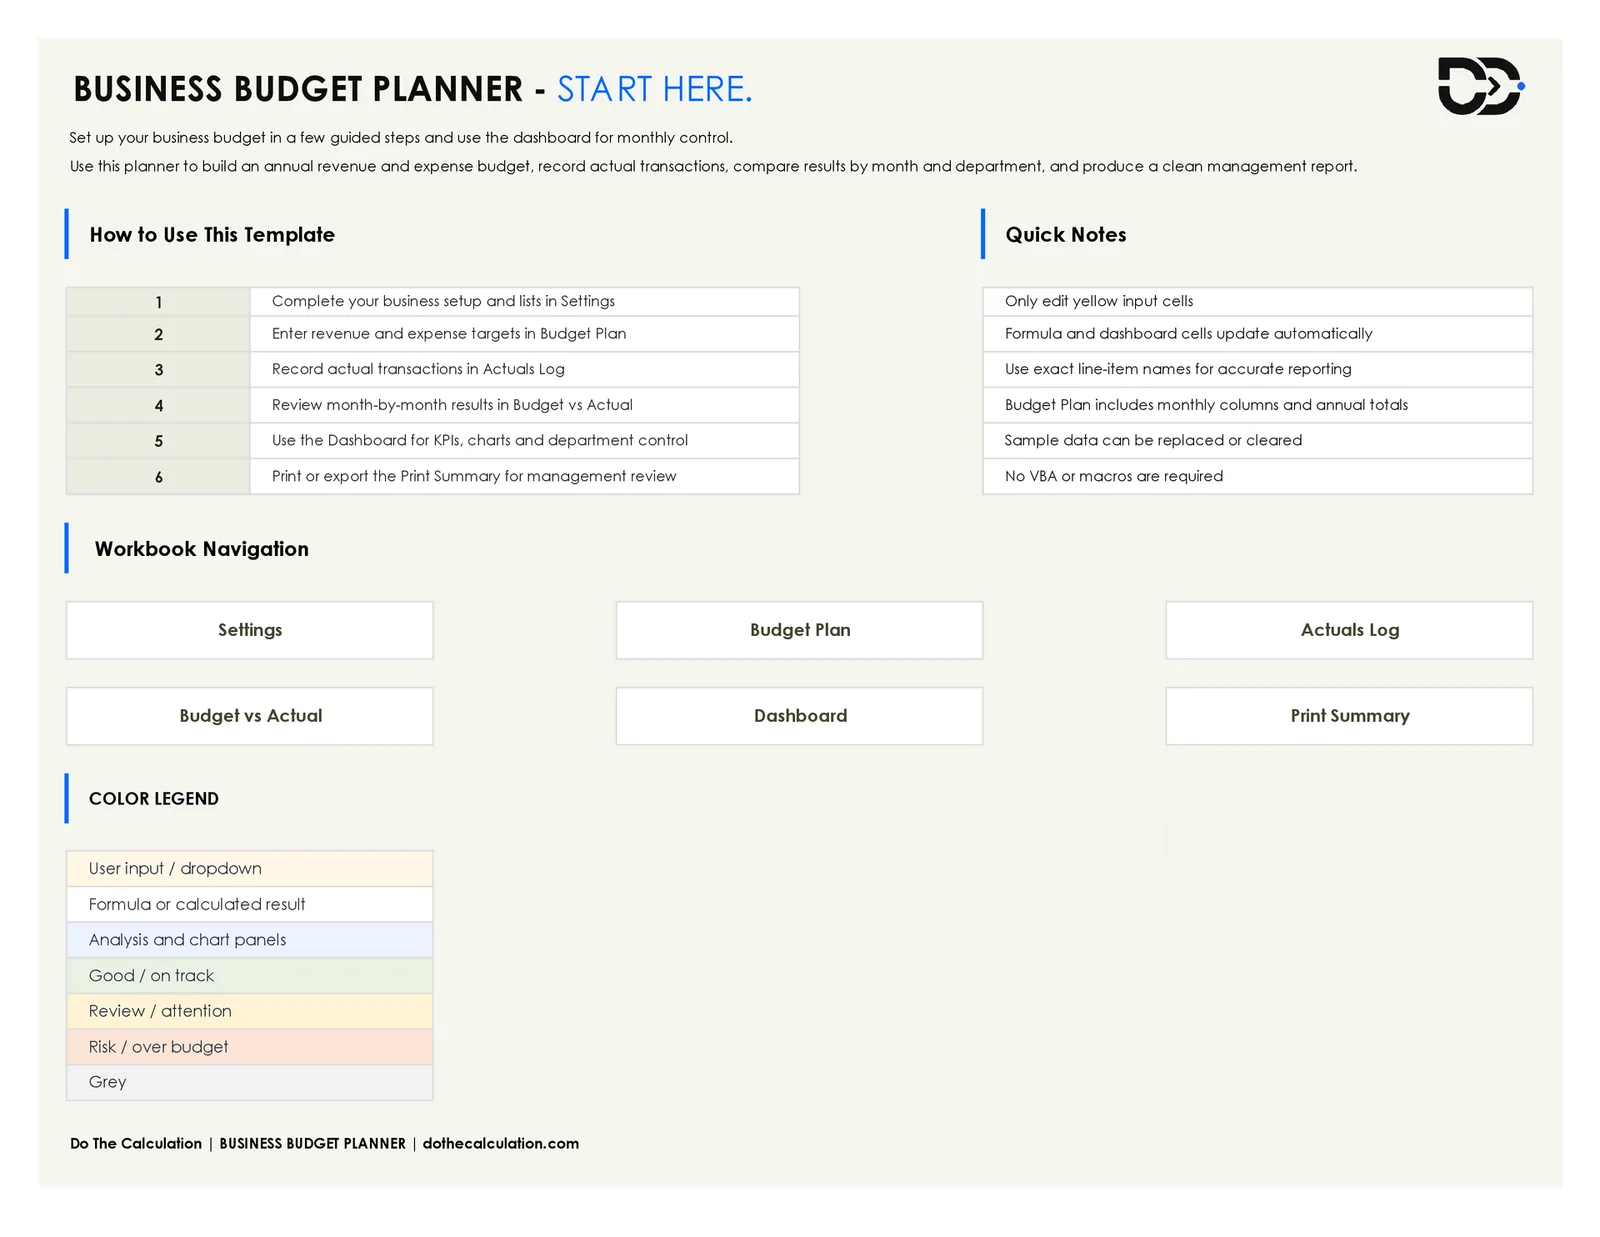
A numbered six-step setup process, a Quick Notes list, a workbook navigation index linking to every sheet, and the color legend used throughout (input cells, formulas, chart panels, and status colors for on-track, review, and over-budget).
3. Settings
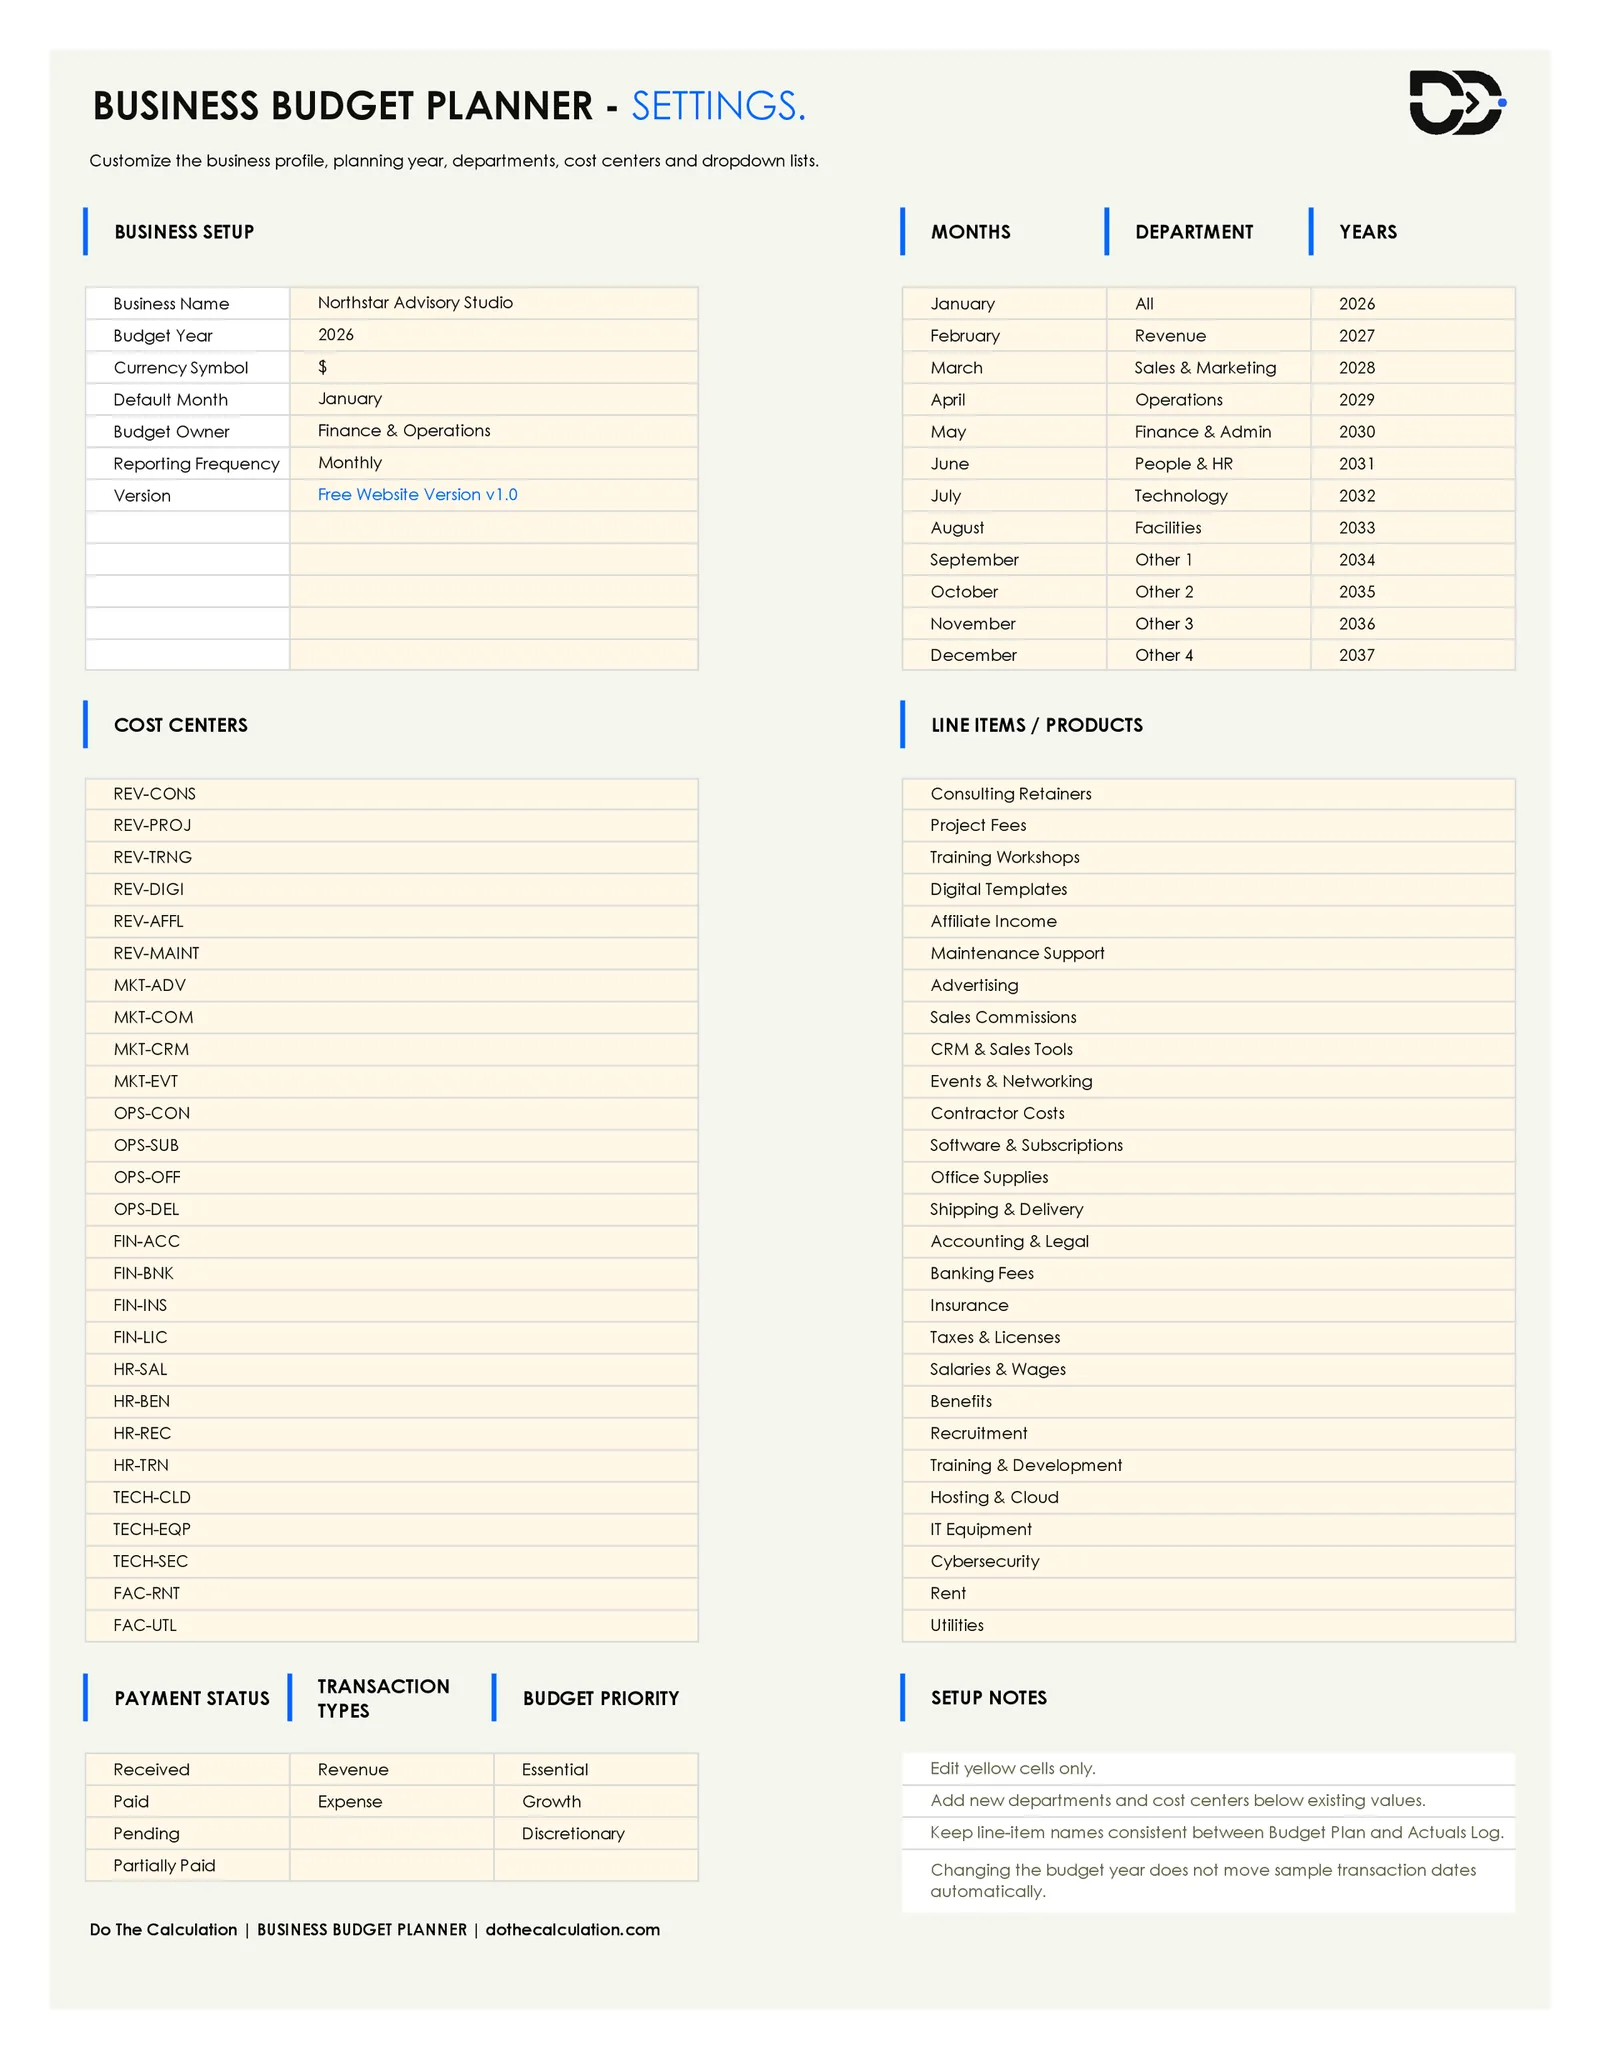
The control panel: Business Setup fields (business name, budget year, currency symbol, default month, budget owner, reporting frequency) alongside editable dropdown lists for Months, Department, Years (2026–2037), Cost Centers, Line Items/Products, Payment Status (Received, Paid, Pending, Partially Paid), Transaction Types (Revenue, Expense), and Budget Priority tags (Essential, Growth, Discretionary).
4. Budget Plan
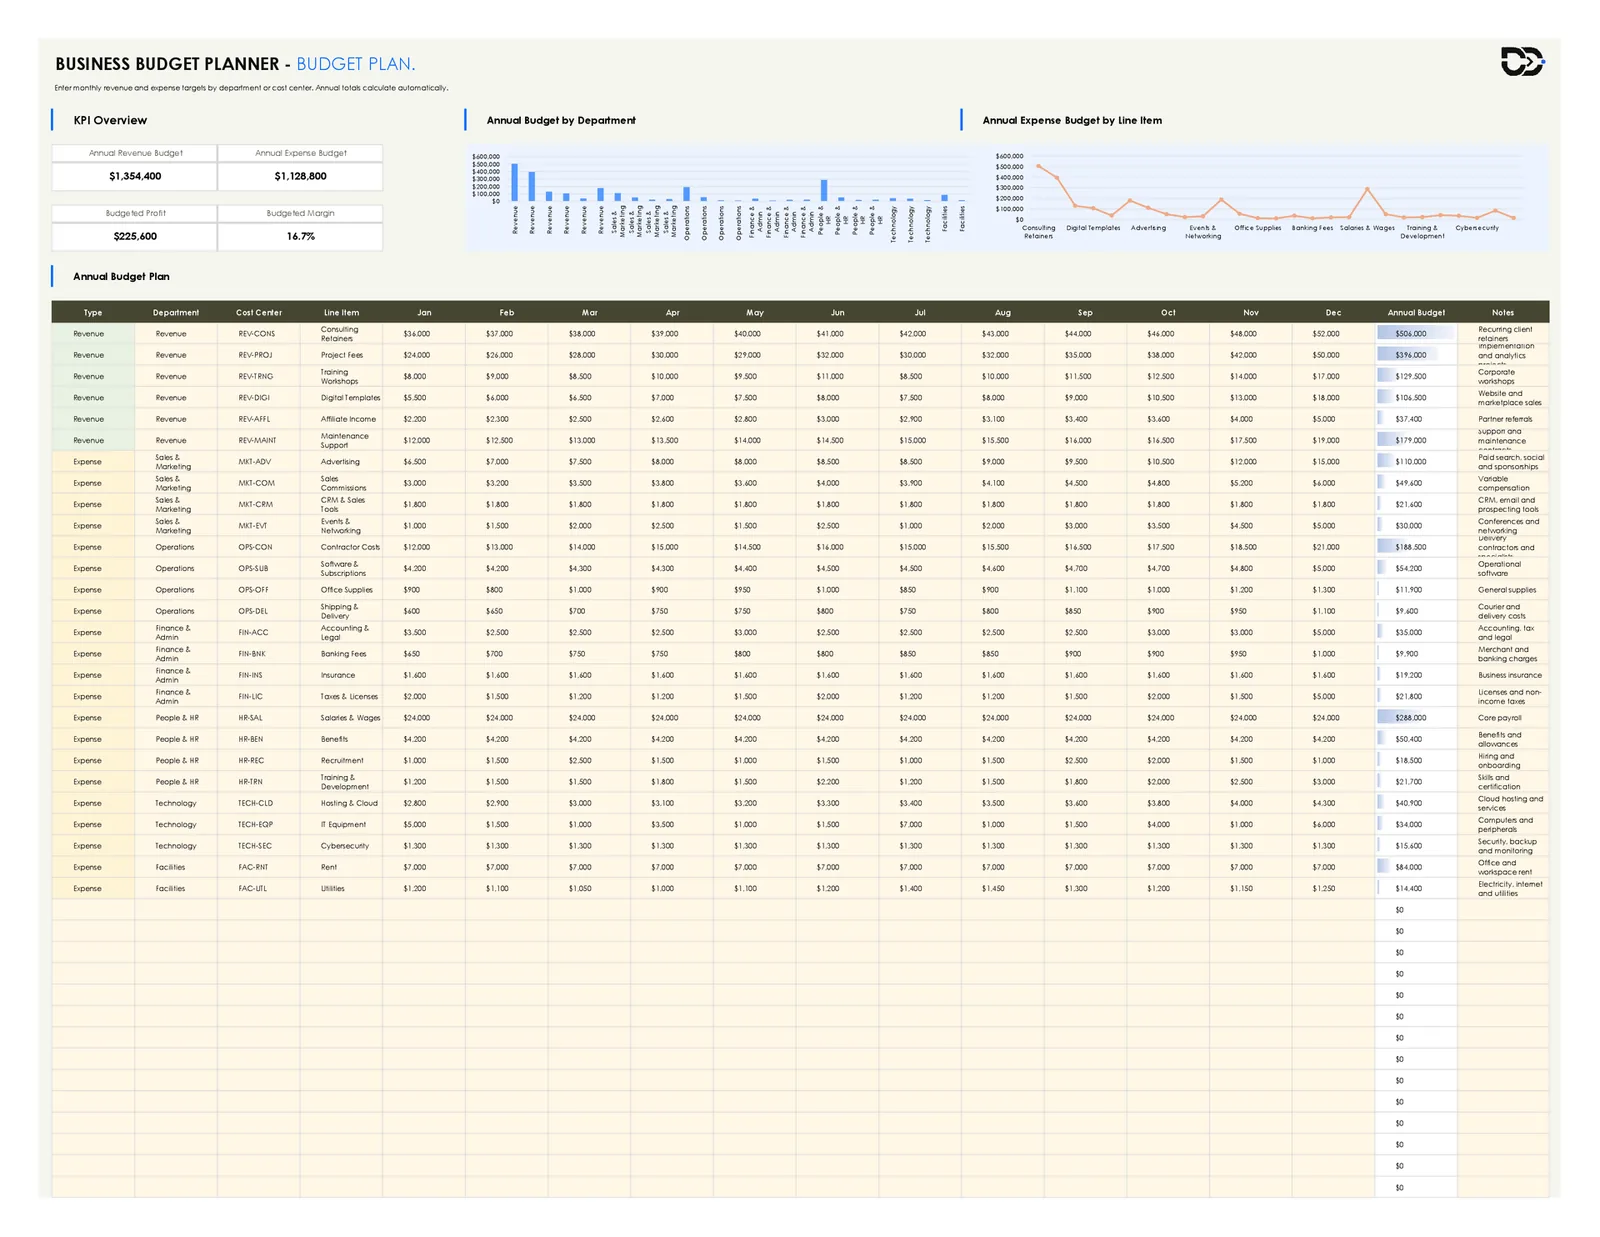
A KPI Overview (Annual Revenue Budget, Annual Expense Budget, Budgeted Profit, Budgeted Margin) backed by two charts, then the full budget table (Type, Department, Cost Center, Line Item, twelve monthly columns, an auto-calculated Annual Budget column, and a Notes field) with blank rows for your own custom line items.
5. Actuals Log
A KPI Overview (Actual Revenue, Actual Expenses, Actual Profit) with a Monthly Amount Trend chart, and the transaction log itself: date, type, department, cost center, line item, description, amount, and payment status, with Month and Year calculated automatically from the date.
6. Budget vs Actual
The variance engine: KPI cards (Annual Revenue Variance, Annual Expense Variance, Annual Profit Variance, Expense Utilization), a full Monthly Budget vs Actual Variance Analysis table, Department Expense Performance and Revenue by Product/Service tables with status flags, and a Management Insights panel. Entirely calculated. Nothing here needs manual input.
7. Dashboard
Report Filters (select a month), a Key Insights panel (best revenue month, highest expense month, most over-budget department, profit status), full-year KPIs, a Selected Month Snapshot, a month-by-month performance table, a department control table, and two trend charts comparing monthly budget to actual.
8. Print Summary
A formatted, printable version of the year's results: report details, a selected-month snapshot, the full monthly performance table, a department expense summary with a recommended action per department, a revenue-by-product breakdown, and an open Management Notes & Actions section, plus two supporting charts.
9. About
Template name, version, brand, website, format confirmation (Excel workbook without VBA/macros), compatibility notes, usage note, disclaimer, and redistribution note. Reference only.
How to Use the Template
- Step 1: Open the workbook and read the Start Here sheet. Skim the six-step setup order, the color legend (yellow = input, white = formula, blue = chart panel), and the navigation index before touching any numbers.
- Step 2: Complete your business setup and lists in Settings. Enter your business name, budget year, currency symbol, default month, budget owner, and reporting frequency, then review the Department, Cost Center, and Line Items/Products lists. Add new rows below the existing ones rather than deleting rows mid-list.
- Step 3: Enter your annual revenue and expense targets in Budget Plan. Working department by department, enter a planned monthly amount for each line item. The Annual Budget column, KPI cards, and charts recalculate as you go.
- Step 4: Record actual transactions in Actuals Log. Log date, type, department, cost center, line item, description, amount, and payment status as transactions happen. Use the exact same names you set up in Settings. Variance analysis depends on them matching precisely.
- Step 5: Review month-by-month results in Budget vs Actual. This sheet needs no input; check the Monthly Variance Analysis table for large variance percentages, then the Department Expense Performance table for anything flagged Over Budget or Watch.
- Step 6: Use the Dashboard for a full-year and month-level view. Set the Selected Month filter to whichever month you're reviewing; the Key Insights panel and Selected Month Snapshot update immediately.
- Step 7: Export or print the Print Summary for a management review. It's laid out for printing or PDF export as-is. Use the Management Notes & Actions section to log decisions before your next review.
- Step 8: Save a new copy for each budget cycle. Because Budget Plan and Actuals Log hold live, editable data, keep a saved copy of each closed-out period and start the next cycle from a fresh copy.
Practical Example
The workbook's sample data follows a small advisory business ("Northstar Advisory Studio") through a full budget year, which makes it a useful way to see the workflow before you replace it with your own numbers.
In the Budget Plan sheet, the business budgets $1,354,400 in annual revenue across six revenue lines (Consulting Retainers, Project Fees, Training Workshops, Digital Templates, Affiliate Income, and Maintenance Support) and $1,128,800 in annual expenses across six departments. That plan produces a budgeted annual profit of $225,600, a 16.7% margin, visible immediately in the KPI Overview cards.
Through the year, actual transactions are recorded in the Actuals Log. For January alone, that's 24 separate entries, one per line item, each dated, described, and tagged with a payment status like Received or Paid. By year-end, actual revenue comes in at $1,295,683 against the $1,354,400 budget, and actual expenses land at $1,140,026 against a $1,128,800 budget.
The Budget vs Actual sheet turns those two totals into a variance analysis without any extra work: revenue came in $58,717 under budget (a 4.3% miss), expenses ran $11,226 over budget (1.0% over), and actual profit landed at $155,657, which is $69,943 behind the original plan. Sales & Marketing, Operations, People & HR, and Technology all finish the year flagged "Over Budget," while Finance & Admin and Facilities are flagged "Watch."
Rather than a single "we spent more than planned" conclusion, the department-level breakdown points to exactly where: Technology finished at 103.8% of its budget, the highest utilization of any department, while Operations overspent by the largest dollar amount ($5,224). That's the kind of detail a flat expense list can't surface on its own, and it's what the Management Insights panel summarizes automatically: revenue performance, expense performance, profit performance, and which departments need review.
This example is included purely to illustrate the workflow. Replace the sample company and numbers with your own before using the workbook for real planning.
Understand the Dashboard and Key Reports
KPI Overview cards
Four full-year totals side by side (Annual Revenue Budget vs. Annual Actual Revenue, and Annual Expense Budget vs. Annual Actual Expenses), plus Budgeted Profit, Actual Profit, Profit Variance, and Expense Utilization.
Report Filters and Selected Month Snapshot
Pick a specific month from a dropdown and instantly see that month's Revenue Actual, Expense Actual, Actual Profit, and Profit Variance, the fastest way to check how last month actually went.
Key Insights panel
Auto-identifies four things: Best Revenue Month, Highest Expense Month, Most Over Budget Department, and overall Annual Profit Status (Below Plan, On Plan, or Above Plan).
Monthly Budget vs Actual Performance table
Lists every month's revenue budget, revenue actual, budgeted profit, actual profit, expense budget, and expense actual, with conditional color shading flagging months where actuals ran unfavorably against budget.
Department Control table
Repeats the department-level Budget, Actual, Variance, Utilization, and Status columns from Budget vs Actual, so you can see departmental spending discipline without leaving the Dashboard.
Trend charts
Two horizontal bar charts plot Monthly Revenue (Budget vs. Actual) and Monthly Expenses (Budget vs. Actual) for all twelve months, making it easy to spot which months diverged from plan at a glance.
Print Summary
Repackages the same data into a report format: a Report Details header, the monthly performance table, a Department Expense Summary with a recommended Action per department, a Revenue by Product/Service breakdown, and a blank Management Notes & Actions section.
Who This Template Is Best For
Small business owners managing more than one department
If your spending naturally splits across areas like sales, operations, and admin, the department and cost-center structure gives you a real breakdown instead of one combined expense total.
Agencies and consultancies with recurring and project-based revenue
The revenue side is built for exactly this mix: retainers, project fees, and one-off income sit as separate trackable lines rather than being lumped into a single "income" row.
Freelancers who've outgrown a single-tab budget
If you're tracking income and expenses in one flat list and want to separate planning from actuals without switching to accounting software, this gives you that structure without the learning curve of a full bookkeeping platform.
Finance or operations leads who report to a manager or partner
The Print Summary sheet and Management Insights panel are built specifically for handing results to someone else: a partner, a manager, or a board.
Anyone who wants budget vs. actual tracking without formulas
If you know what you want to track but don't want to build SUMIFs, variance formulas, or charts from scratch, the workbook's structure does that calculation work for you.
Excel-first users who don't want browser-based software
If you prefer working offline in a spreadsheet you fully own and control, rather than logging into a SaaS budgeting tool, this stays entirely within Excel.
Teams that want a printable, month-end report
If your budgeting process includes a review meeting or a report someone reads, the Print Summary sheet is built to be exported or printed as-is.
Who This Template May Not Be For
- Businesses that need automatic bank or accounting software sync. This is a manual-entry workbook; there's no bank feed, no accounting software integration, and no automatic transaction import.
- Teams that need multi-user, real-time collaboration. As an Excel file, it's built for one person (or a small team passing a file back and forth) to edit at a time, not simultaneous multi-user editing.
- Businesses that need multi-year comparison in a single view. The Years list runs to 2037 for setting your current budget year, but the workbook itself is built around a single budget year at a time.
- Anyone who needs investment planning, forecasting models, or tax preparation. This is a budget-and-actuals tracker, not a financial forecasting, investment planning, or tax filing tool.
- Users who need built-in automation, macros, or advanced Power Query pipelines. The workbook intentionally uses no VBA or macros, so scripted imports or automated pipelines would need to be added separately.
- Anyone looking for professional financial, legal, tax, or accounting advice. The workbook is a planning and organization tool; it doesn't replace a licensed accountant, bookkeeper, or financial advisor.
Why This Template Is Different
A blank spreadsheet can hold numbers. It can't tell you that Technology finished the year at 103.8% of its budget, or that your highest-expense month was December, without you building that logic yourself. What separates this template from a plain budget list is the structure connecting its sheets: Settings feeds the dropdowns everywhere else, Budget Plan and Actuals Log feed Budget vs Actual, and Budget vs Actual feeds both the Dashboard and the Print Summary. Enter a number once, in the right place, and it flows through the rest of the workbook.
The department and cost-center coding system is doing real work too. Because every line item carries both a department and a specific cost center code, you get two levels of detail for free: a department-level rollup for a quick check, and a cost-center-level breakdown when you need to know exactly which expense is driving a department over budget.
The variance analysis is the other piece a blank sheet won't give you without effort: dollar and percentage variance, calculated automatically for every month, for revenue, expenses, and profit, plus a status flag (on track, watch, or over budget) per department, built from a defined utilization threshold rather than a subjective read of the numbers.
None of this requires you to write a formula, build a chart, or design a report layout. The structure, the color-coded input system, the charts, and the print-ready report are already built. Your work is limited to entering your business's own numbers into the yellow input cells.
What You Get in the Download
The download is a single ZIP folder with everything you need to get started right away:
- A ready-to-use Business Budget Planner workbook (.xlsx), pre-filled with a full year of sample data (Northstar Advisory Studio) so you can see the budget, actuals, variance, and dashboard working together before you clear it out and enter your own numbers.
- A blank starter workbook (.xlsx), the same nine sheets with the sample data cleared out, ready for you to fill in your own budget from a clean workbook.
- A short note file: a quick summary of what is in the download and where to go if you need something beyond the free version.
Practical Tips Before You Start
- Set up Settings completely before entering any budget numbers: the dropdowns in Budget Plan and Actuals Log pull directly from the Department, Cost Center, and Line Items lists there.
- Keep department, cost center, and line item names identical across sheets: a transaction logged as "Software & Subscriptions" won't roll up correctly if the Budget Plan line item is spelled differently.
- Add new departments and cost centers below the existing list, not in the middle: inserting rows mid-list can break the dropdown ranges that reference them.
- Log actual transactions as they happen, not at month-end: batching a month's worth of transactions in one sitting increases the chance of misclassified entries.
- Use the Notes columns: both Budget Plan and Actuals Log have a Notes field; record why a number is unusual so the context is there when you review variance later.
- Check the Budget vs Actual status flags monthly, not just at year-end: catching a department trending toward Over Budget in month three is far more useful than seeing it in month twelve.
- Save a dated copy at the close of each month or budget cycle: Budget Plan and Actuals Log hold live data, so periodic saved copies give you a clean historical record.
- Clear the sample data deliberately, not accidentally: delete the sample rows before entering your own numbers, but leave the header rows, formulas, and column structure intact.
- Review the Dashboard's month filter after each entry session: it's the fastest way to sanity-check that a newly logged transaction landed in the right department and month.
- Back up before any large edit: formulas that reference a cost center list can break if that list changes shape.
Common Mistakes to Avoid
- Typing dates as text instead of actual dates: the Actuals Log calculates Month and Year automatically from the Date column, which only works with a real date value.
- Misspelling or slightly varying a department, cost center, or line item name: the single most common way variance tracking breaks; "Finance & Admin" and "Finance and Admin" won't match up in Budget vs Actual.
- Overwriting formula cells with typed values: the white cells (annual totals, variance calculations, KPI cards) are formulas, not input fields.
- Creating too many one-off cost centers: adding a new cost center for every unusual expense makes the Department Expense Performance table harder to read; use the Notes column for one-off context instead.
- Entering only totals instead of individual transactions in Actuals Log: a single lump-sum monthly entry loses the transaction-level detail that makes the log useful for later review.
- Comparing an incomplete month against a full month's budget: if you check Budget vs Actual partway through a month, the actual figure will naturally look under-budget simply because the month isn't finished.
- Deleting sample rows without checking dropdown ranges: validation set on a specific row range doesn't automatically extend to newly added rows below it.
- Skipping the Settings setup and editing Budget Plan directly, which creates a mismatch between what the dropdowns offer and what's actually being tracked.
Limitations and Honest Notes
- This template is a planning and tracking tool. It is not financial, accounting, legal, tax, or investment advice, and it doesn't replace a qualified professional.
- There's no bank feed or accounting software connection. Every transaction in the Actuals Log is entered manually.
- The workbook uses no VBA or macros by design.
- It's built primarily for Microsoft Excel; Google Sheets compatibility is reasonable but not guaranteed to be identical, particularly for chart formatting.
- Formulas can break if input cells are overwritten or if department, cost center, or line item names don't match exactly across sheets. Save a backup copy before making structural changes.
- This free version is a single-year, sample-data workbook, built for annual budgeting and monthly actuals tracking within one budget year, not multi-year forecasting in a single view.
- Printer output and page layout may vary slightly depending on your printer and regional paper size settings; review the Print Summary sheet's print preview before exporting.
- Unauthorized resale or redistribution of the template file itself is not permitted.
Frequently Asked Questions
Is the Business Budget Planner template really free?
Yes. This is the free website version (v1.0), available as a direct download with no sign-up required.
Does this template work in Google Sheets, or only Excel?
It's built and designed in Microsoft Excel and works fully there. It has reasonable compatibility with Google Sheets, though some chart formatting and conditional formatting may render slightly differently after upload.
Does the workbook use macros or VBA?
No. The entire workbook runs on standard Excel formulas: there's no VBA, no macros, and no add-ins required to use it.
Can I add my own departments, cost centers, or expense categories?
Yes. The Settings sheet holds editable lists for Department, Cost Center, and Line Items/Products. Add new entries below the existing rows to keep the dropdowns throughout the workbook working correctly.
Can I print or export a summary report?
Yes. The Print Summary sheet is formatted specifically for printing or exporting as a PDF, with a monthly performance table, department summary, revenue breakdown, and a notes section for a management review.
Does the template track actual transactions, or just planned budget figures?
Both. The Budget Plan sheet holds your planned monthly targets, and the separate Actuals Log records real transactions with dates, descriptions, and payment status. The Budget vs Actual sheet compares the two automatically.
Is there a dashboard included?
Yes. The Dashboard sheet shows annual KPIs, a month-selectable snapshot, auto-generated insights (best revenue month, most over-budget department, and similar), a department status table, and trend charts.
Is this suitable for a complete beginner in Excel?
Yes, with the caveat that you should read the Start Here sheet first. Input cells are color-coded yellow, and the workbook's structure is guided step by step. You don't need to write formulas to use it, just enter numbers in the correct places.
Is this financial, accounting, legal, or tax advice?
No. It's a planning and organization tool designed to help you structure your own budget and actuals. It doesn't replace a licensed accountant, bookkeeper, or financial advisor.
Can I change the currency symbol?
Yes. The currency symbol is set in the Settings sheet's Business Setup panel and can be updated to match your own currency.
What happens if I accidentally overwrite a formula cell?
The affected cell will stop calculating and show whatever value you typed instead. The safest fix is to copy the same formula from an adjacent, unedited row and paste it into the affected cell, or restore from a saved backup copy.
Can I reuse this template for future budget years?
Yes. Update the Budget Year field in Settings, clear the prior year's Budget Plan and Actuals Log entries, and re-enter your new targets and transactions. Keeping a saved copy of each completed year first preserves your history.
Is there a Premium or custom version of this template?
This free download is the standard website version. If you need a Premium version with more features, or a custom Excel or Google Sheets template built around your own department structure or reporting needs, share your query and details at quote@dothecalculation.com and we'll send you a quote for that work.
Why does the Actuals Log show a fictional company's data instead of blank rows?
The free version ships with a full year of sample data (a fictional business, "Northstar Advisory Studio") so you can see exactly how the formulas, charts, and status flags behave before entering your own numbers. Clear the sample rows and replace them with your own data when you're ready to start.