Template previews
Free Amazon FBA Profit Calculator Excel Template
Every free Amazon FBA calculator online will give you a profit number. Fewer will tell you what price actually covers your costs, what price you need for the margin you want, whether the Individual or Professional selling plan wins at your volume, or what a 10% price cut does to your ROI, all for the same product, side by side, without re-entering your numbers four separate times.
This workbook is the offline, editable version of Do The Calculation's own Amazon FBA Profit Calculator. It's built around one Main Calculator sheet: enter a selling price, an item cost, a shipping cost, and pick a referral fee and fulfillment preset (or enter your own), and the sheet works out net profit, net margin, ROI, total Amazon fees, and monthly profit at your expected sales volume, then goes a step further with break-even pricing, target-margin pricing, target-ROI pricing, a seller-plan comparison, and a price sensitivity table, all calculated from the same inputs.
It ships with a Settings & Guide sheet that documents every formula, every preset, and every source link the workbook uses, so nothing here is a black box, and the sample product ($29.99 selling price, $8.50 item cost) is filled in from the start so you can see how the sheets connect before replacing it with your own numbers.
The sections below walk through what's actually in the file and how to use it before you source a product.
What This Template Helps You Do
- See true per-unit profit after every Amazon fee. Net Profit, Net Margin, and ROI are calculated from your selling price, item cost, inbound shipping, referral fee, fulfillment fee, storage, and any other per-unit costs you add.
- Pick the right fee assumptions without guessing. Referral fee presets (Standard 15%, Consumer Electronics 8%, or Custom) and fulfillment size presets (Small, Standard, Large, or Custom) are built in, matching the same presets used on the live calculator.
- Find three different prices, not just one. Break-even selling price, the price needed for your target margin, and the price needed for your target ROI are calculated together, so you can see how much room sits between "won't lose money" and "hits my actual goal."
- Compare Professional vs. Individual selling plans at your own volume. The Seller Plan Comparison table shows fee per unit, profit per unit, and monthly profit for both plans side by side at your expected units per month, plus the exact volume where one plan overtakes the other.
- Stress-test a price change before making it. The Price Sensitivity table shows profit per unit, net margin, and ROI at −10%, −5%, the current price, +5%, and +10%, with room to add your own rows.
- Get a plain-language read on the numbers. The Dynamic Insights panel checks your margin against a healthy threshold, your price against your target-margin price, and which selling plan currently costs less at your volume.
- Keep an editable, offline record per product. Because it's a plain .xlsx file, you can save one copy per product you're evaluating and come back to it without needing a browser tab open.
What's Included in the Workbook
The workbook contains three sheets:
1. Settings & Guide
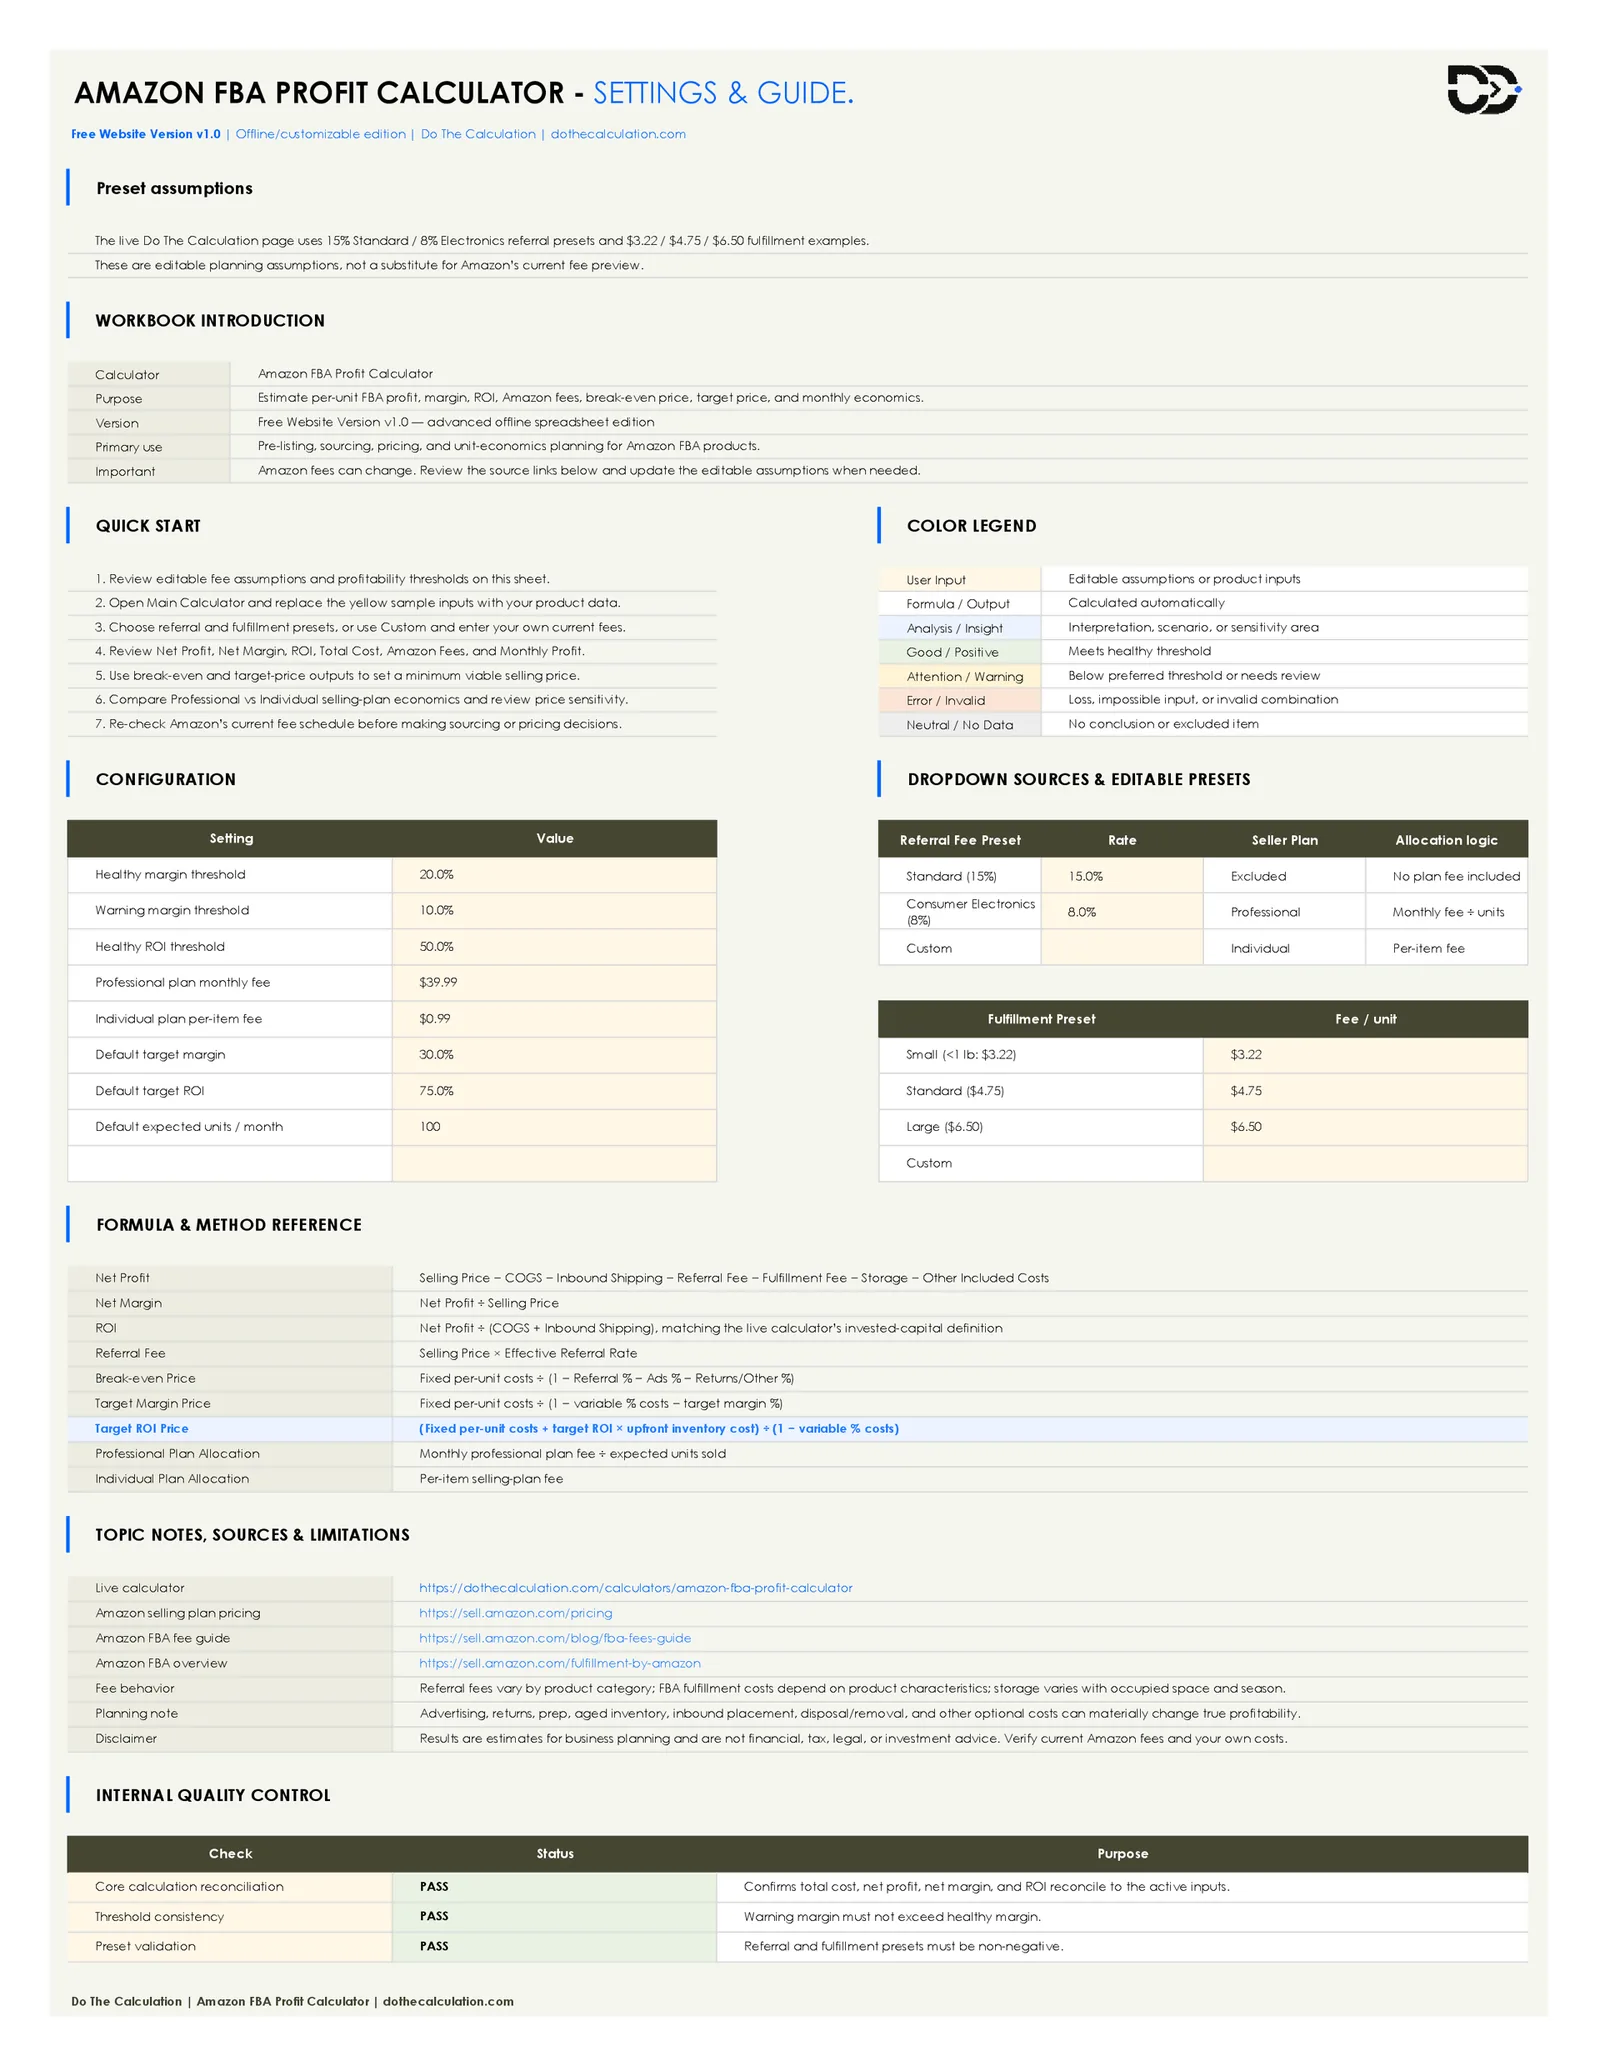
The reference and configuration sheet. It opens with a Preset Assumptions note stating plainly that the live Do The Calculation page uses the same 15% Standard / 8% Electronics referral presets and $3.22 / $4.75 / $6.50 fulfillment examples used here, and that these are editable planning assumptions, not a substitute for Amazon's current fee preview. Below that: a Workbook Introduction table, a seven-step Quick Start checklist, a seven-item Color Legend, a Configuration table (healthy margin threshold, warning margin threshold, healthy ROI threshold, Professional plan monthly fee, Individual plan per-item fee, default target margin, default target ROI, default expected units/month), the Dropdown Sources & Editable Presets tables for referral fees and fulfillment sizes, a Formula & Method Reference table spelling out all nine core formulas, a Topic Notes, Sources & Limitations table with links to the live calculator and Amazon's own fee pages, and an Internal Quality Control table confirming three checks all pass.
2. Main Calculator
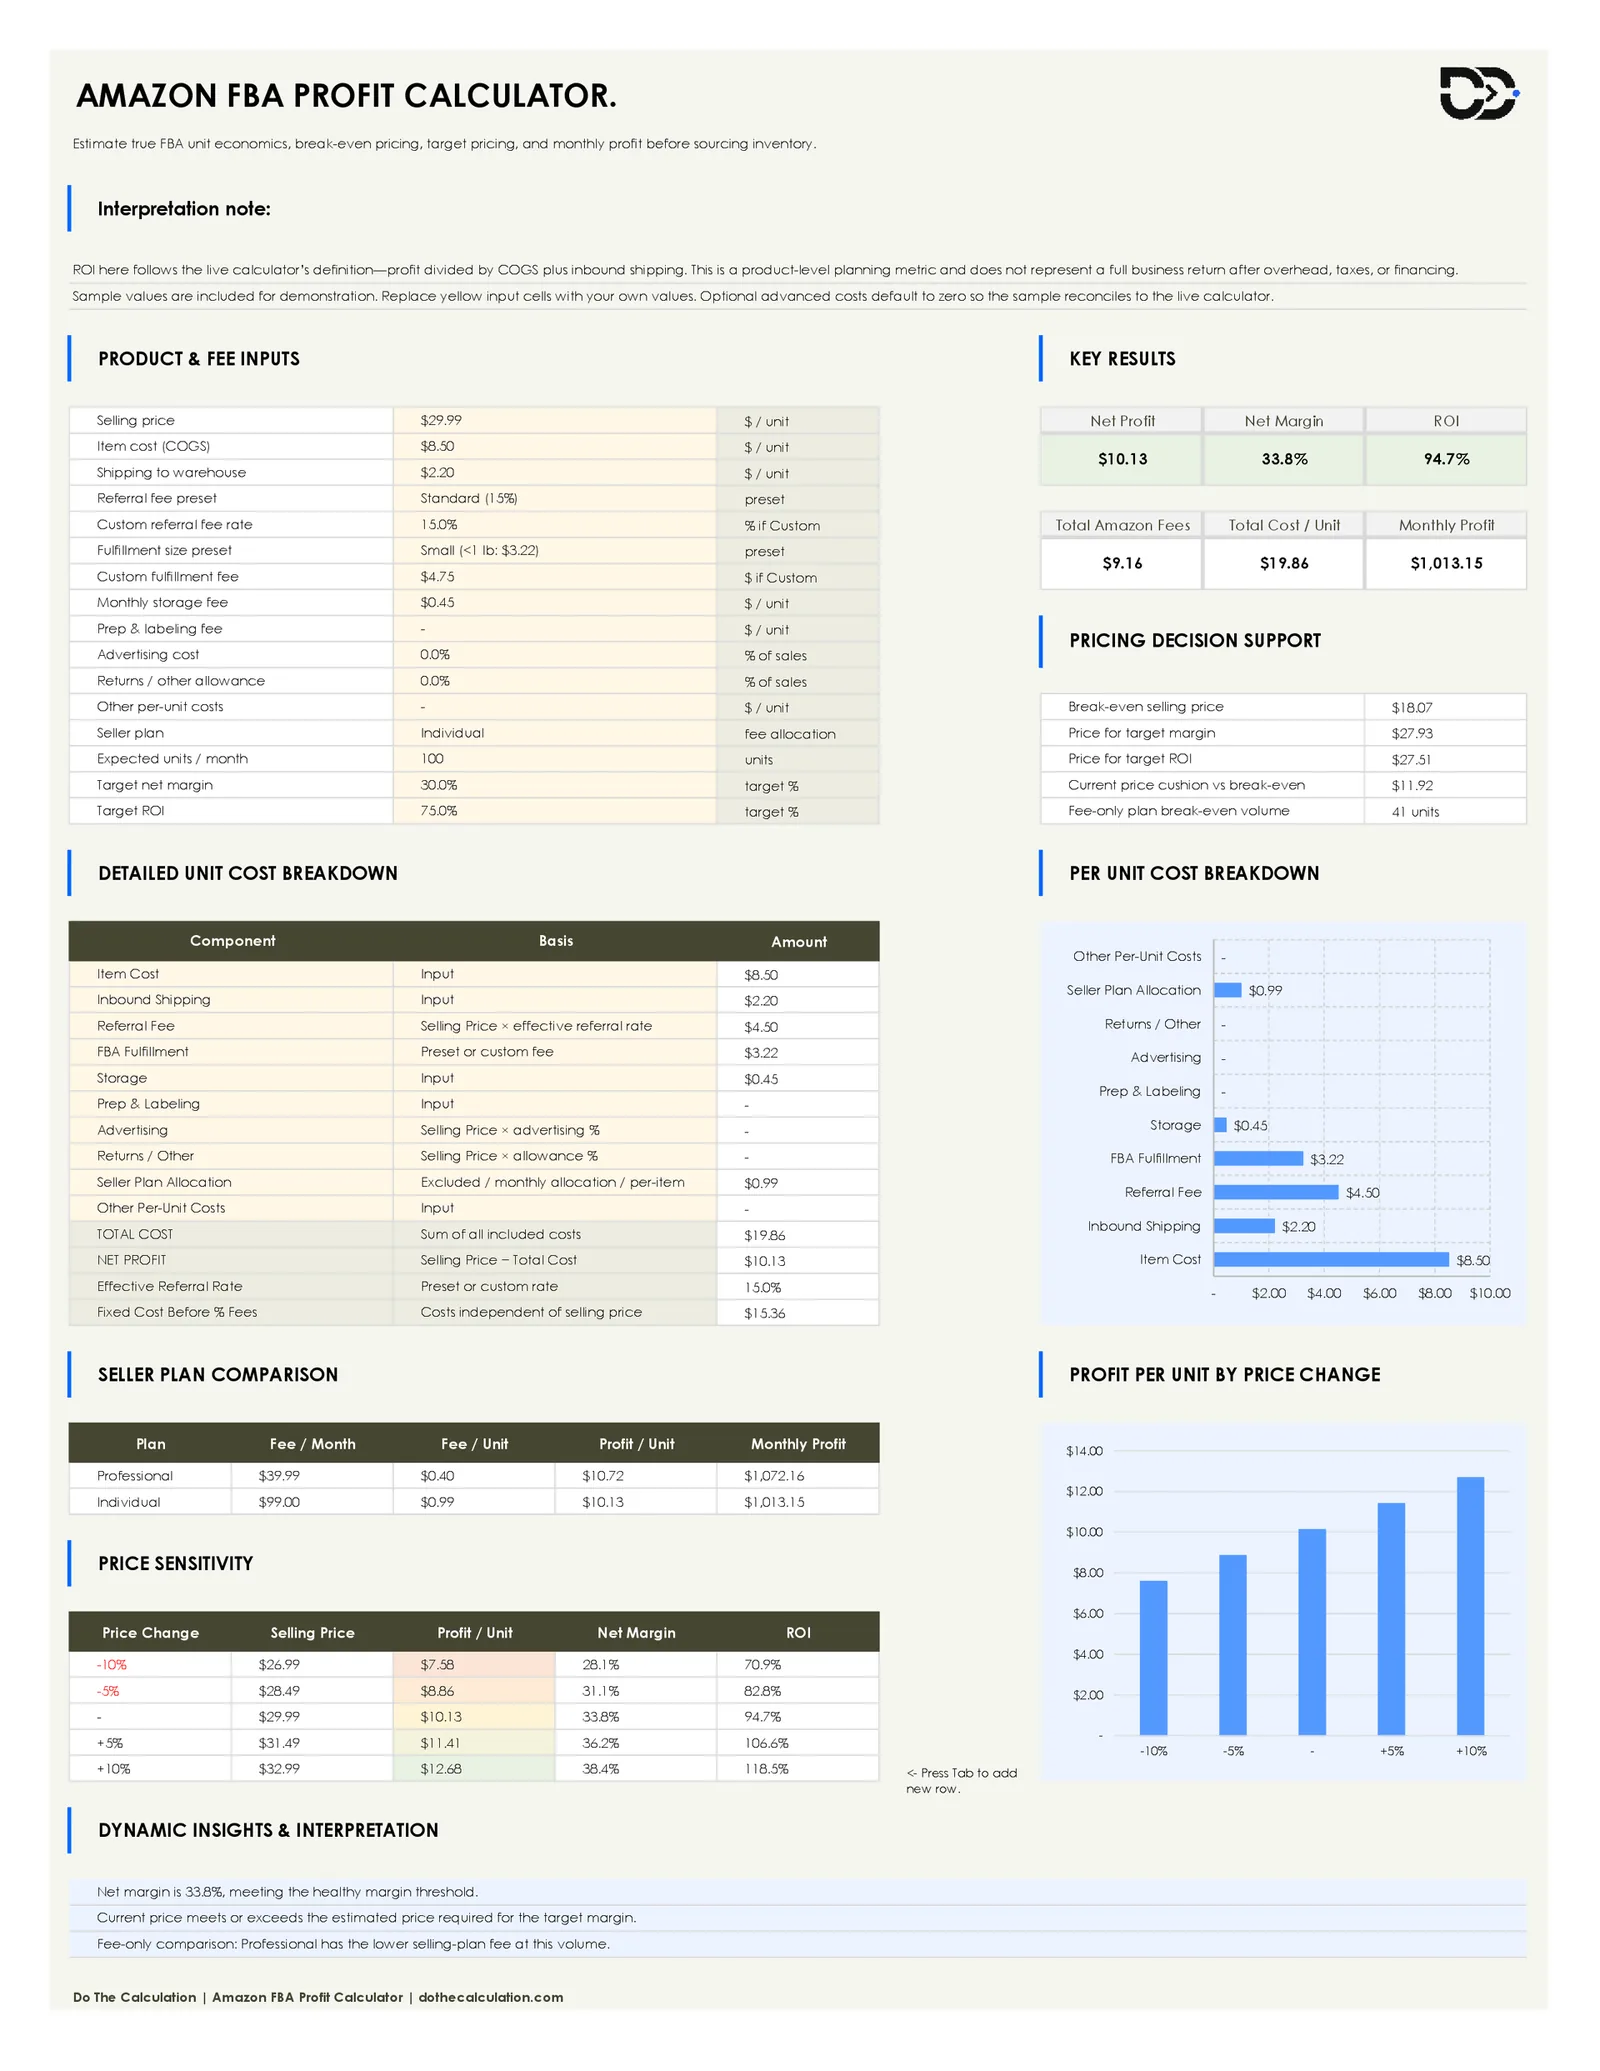
The working sheet. An Interpretation note explains upfront that ROI here follows the live calculator's definition (profit divided by COGS plus inbound shipping) and that sample values are included for demonstration. Below that: a Product & Fee Inputs panel, a Key Results panel (Net Profit, Net Margin, ROI, Total Amazon Fees, Total Cost/Unit, Monthly Profit), a Pricing Decision Support panel (break-even selling price, price for target margin, price for target ROI, current price cushion vs. break-even, fee-only plan break-even volume), a Detailed Unit Cost Breakdown table with a matching bar chart, a Seller Plan Comparison table, a Price Sensitivity table with a matching bar chart, and a Dynamic Insights & Interpretation panel.
3. About
Template name, version, brand, format confirmation (Excel workbook without VBA/macros), Google Sheets compatibility note, usage note, disclaimer, and redistribution note. Reference only.
How to Use the Template
- Step 1: Read the Settings & Guide sheet first. The Preset Assumptions note and Quick Start checklist explain what the presets mean and what order to work through the Main Calculator in.
- Step 2: Review the editable thresholds in Configuration. Healthy margin (20%), warning margin (10%), and healthy ROI (50%) drive the "Good/Positive" vs. "Attention/Warning" read you'll see later in Dynamic Insights. Adjust them if your own target is different.
- Step 3: Open Main Calculator and enter your product's numbers. Replace the yellow sample inputs (selling price, item cost, shipping to warehouse) with your own product's figures.
- Step 4: Choose your referral and fulfillment presets, or go Custom. Pick Standard (15%) or Consumer Electronics (8%) if your product fits, or select Custom and type in the exact referral rate and fulfillment fee for your category and size tier.
- Step 5: Enter your selling plan and expected volume. Choose Professional or Individual, and enter the units per month you realistically expect to sell. This drives both the Monthly Profit figure and the Seller Plan Comparison table.
- Step 6: Read Net Profit, Net Margin, ROI, and Monthly Profit in Key Results. This is the fast answer to "is this product worth sourcing."
- Step 7: Check Pricing Decision Support before you set a final price. Break-even price tells you the floor; price for target margin and price for target ROI tell you what it actually takes to hit your goals, not just avoid a loss.
- Step 8: Review Price Sensitivity and Seller Plan Comparison before you commit. See what a 5–10% price move does to your margin and ROI, and confirm which selling plan actually costs less at the volume you entered.
Practical Example
The workbook's own sample product is worth walking through in full, because every number in it is real output from the sheet, not a made-up illustration.
The sample product sells for $29.99, costs $8.50 to make, and $2.20 to ship to the warehouse. With the Standard (15%) referral preset selected, the referral fee comes to $4.50, and with the Small fulfillment preset ($3.22 per unit) plus a $0.45 monthly storage fee, total Amazon fees land at $9.16 per unit. On the Individual selling plan at 100 expected units per month, the per-item fee allocation adds $0.99. Total cost per unit comes to $19.86, leaving a Net Profit of $10.13, a Net Margin of 33.8%, and an ROI of 94.7%, both comfortably above the workbook's own healthy thresholds of 20% margin and 50% ROI.
The Pricing Decision Support panel puts that result in context. The break-even selling price, the floor below which this product loses money, works out to $18.07, meaning the current $29.99 price carries an $11.92 cushion before it stops being profitable. The price needed to hit the 30% target margin is $27.93, and the price needed for the 75% target ROI is $27.51. The current $29.99 price already clears both, which is exactly what the Dynamic Insights panel reports in plain language.
The Seller Plan Comparison table shows something the Key Results panel alone wouldn't: at 100 units a month, switching from Individual to Professional would raise monthly profit from $1,013.15 to $1,072.16, about $59 more, because the Professional plan's $39.99 flat monthly fee, spread across 100 units, comes to $0.40 per unit versus Individual's flat $0.99 per unit. The workbook's own Fee-Only Plan Break-Even Volume figure explains why: at 41 units a month, $39.99 ÷ 41 ≈ $0.98, almost exactly matching Individual's per-item fee, so above roughly 41 units a month, Professional wins on fees alone, and below it, Individual does.
Finally, the Price Sensitivity table shows what room there is to move. Cutting the price 10% to $26.99 still leaves a $7.58 profit per unit, a 28.1% margin, and a 70.9% ROI, still above the healthy thresholds. Raising it 10% to $32.99 pushes profit per unit to $12.68, margin to 38.4%, and ROI to 118.5%. Neither move breaks the product; the table exists so you can see that before you make the change, not after.
This example uses the workbook's own sample figures to show how the sheets connect. It isn't a real product listing, and the result for any specific product depends entirely on the fees, costs, and category you enter.
Understanding the Calculator and Key Outputs
Product & Fee Inputs
Fifteen input rows cover everything the formulas need: selling price, item cost, shipping to warehouse, a referral fee preset (with a custom-rate override), a fulfillment size preset (with a custom-fee override), monthly storage fee, prep & labeling fee, advertising cost as a percentage of sales, a returns/other allowance as a percentage of sales, any other per-unit costs, your selling plan, expected units per month, and your target net margin and target ROI.
Key Results
Six cards: Net Profit, Net Margin, and ROI per unit, plus Total Amazon Fees, Total Cost/Unit, and Monthly Profit at your expected volume. This is the panel built to answer "is this product worth it" in one glance.
Pricing Decision Support
Five figures that turn the raw profit number into a pricing decision: break-even selling price, price for target margin, price for target ROI, your current price's cushion above break-even, and the fee-only volume at which the Professional plan's flat fee starts beating the Individual plan's per-item fee.
Detailed Unit Cost Breakdown
A line-by-line table (Item Cost, Inbound Shipping, Referral Fee, FBA Fulfillment, Storage, Prep & Labeling, Advertising, Returns/Other, Seller Plan Allocation, Other Per-Unit Costs), each with its basis and its dollar amount, totaling to TOTAL COST and NET PROFIT. A matching horizontal bar chart makes it obvious at a glance which single cost is eating the most margin (Item Cost and Referral Fee are usually the two largest bars).
Seller Plan Comparison
A direct Professional-vs-Individual comparison (fee per month, fee per unit at your volume, profit per unit, and monthly profit for both), so you're never guessing which plan actually costs less for your specific product and volume.
Price Sensitivity
A five-row table (−10%, −5%, current price, +5%, +10%) recalculating selling price, profit per unit, net margin, and ROI at each point, with a matching bar chart and a note that you can press Tab to add your own rows for finer price steps.
Dynamic Insights & Interpretation
A short plain-language readout: for example, confirming whether your margin meets the healthy threshold, whether your current price meets or exceeds the price needed for your target margin, and which selling plan currently has the lower fee at your volume.
Who This Template Is Best For
Sellers evaluating a product before sourcing it
If you're deciding whether to place a purchase order, running the real numbers (after every Amazon fee, not just cost vs. selling price) before you commit money to inventory is exactly what the Main Calculator sheet is built for.
Private-label and wholesale sellers comparing referral fee categories
With Standard (15%), Consumer Electronics (8%), and Custom presets built in, you can see how much a product's category alone changes its margin without recalculating fees by hand.
Sellers deciding between the Professional and Individual plan
The Seller Plan Comparison table and the fee-only break-even volume figure answer the "which plan actually costs less for me" question directly, using your own expected volume instead of a rule of thumb.
Sellers who want to test a price change before making it
The Price Sensitivity table shows the margin and ROI impact of a price move in both directions before you touch your live listing.
Sellers who evaluate several products and want a saved record per product
Because it's a plain .xlsx file rather than a browser session, you can save one completed copy per product you're considering and compare them side by side later.
Anyone who wants to see the formulas, not just the output
The Settings & Guide sheet documents every formula and every source link, so you can check the math yourself instead of trusting a black-box result.
Who This Template May Not Be For
- Sellers who want an ASIN lookup or automatic data pull. This workbook takes manually entered inputs; it doesn't pull price, weight, or category data from an Amazon listing automatically.
- Sellers who need a full multi-SKU portfolio view. This is a single-product calculator. Evaluating a full catalog means saving one copy per product rather than seeing every SKU on one sheet.
- Sellers who need every current Amazon fee modeled precisely. Inbound placement fees, aged-inventory surcharges, and other fee changes Amazon has introduced over time aren't broken out as separate line items; the Settings & Guide sheet's Planning Note flags this directly and points you to Amazon's own fee pages to confirm current numbers.
- Anyone who needs live-synced Amazon fee data. Referral and fulfillment fees are editable presets you maintain yourself, not a live feed from Amazon's fee schedule.
- Anyone who needs tax, legal, accounting, or investment advice. The workbook calculates the numbers you enter; it doesn't interpret them for tax or legal purposes.
- Users who want VBA macros or one-click automation. The workbook is intentionally built without macros.
Why This Template Is Different
Most free FBA calculators, including Do The Calculation's own live browser version, are built to answer one question at a time: enter your numbers, get a profit figure. This spreadsheet keeps three different pricing questions open at once: what's the floor (break-even price), what does it take to hit your margin goal (price for target margin), and what does it take to hit your ROI goal (price for target ROI), calculated together from the same inputs, so you can see the gap between them instead of running the calculator three separate times.
It also does something a single-answer calculator can't: it compares your two selling-plan options side by side at your actual volume, and it shows what a price change would do before you make it, using a price sensitivity table rather than a single static result. And because every formula is documented on the Settings & Guide sheet and matches the live calculator's own logic, down to using the same invested-capital definition of ROI, the offline and online versions never disagree.
Practical Tips Before You Start
- Confirm the actual Amazon fee category for your product before trusting the Standard (15%) or Consumer Electronics (8%) preset. Use Custom and enter the exact rate if your category differs.
- Confirm your product's real fulfillment size tier against Amazon's current dimensions and weight brackets rather than assuming Small, Standard, or Large from the preset examples alone.
- Re-check Amazon's fee schedule periodically: the Settings & Guide sheet's Planning Note is explicit that referral fees, fulfillment costs, and storage rates all change over time.
- Enter your actual expected units per month, not the sample's 100: the Seller Plan Comparison and Monthly Profit figures are only useful at your own realistic volume.
- If you plan to run PPC or expect a meaningful return rate, fill in the Advertising and Returns/Other percentage fields rather than leaving them at zero: both feed directly into Net Profit.
- Test both the Individual and Professional plan at your real volume rather than assuming one is always cheaper: the crossover point depends entirely on units per month.
- Use the Price Sensitivity table before changing a live listing price, not after, so you know the margin and ROI impact in advance.
- Save a separate copy of the workbook per product you're evaluating, since the sheet is built around one product's economics at a time.
- Don't overwrite the Key Results, Detailed Unit Cost Breakdown, or Dynamic Insights formula cells: they recalculate from the input panel automatically.
Common Mistakes to Avoid
- Using the Standard or Consumer Electronics preset without checking your product's actual category: the wrong referral rate throws off every downstream number.
- Leaving Advertising or Returns/Other at zero when you know you'll run ads or expect returns: this overstates Net Profit and ROI.
- Assuming Individual is always cheaper because it has no monthly fee: above the fee-only break-even volume, Professional's flat fee costs less per unit than Individual's per-item fee.
- Comparing plans at the sample's 100 units/month instead of your own volume: the crossover point moves with volume, so the comparison only means something at your real numbers.
- Confusing ROI here with a full business return: this ROI is Net Profit divided by COGS plus inbound shipping only, a product-level planning metric, not a return after overhead, taxes, or financing.
- Overwriting a formula cell in Key Results or the Unit Cost Breakdown: these are calculated outputs; if a result stops updating, check whether the formula is still intact.
- Treating the referral and fulfillment presets as permanently accurate: they're editable planning assumptions dated to when the workbook was built, not a live Amazon fee feed.
Limitations and Honest Notes
- Results are estimates for business planning and are not financial, tax, legal, or investment advice.
- Referral fees, fulfillment fees, and storage rates are editable planning assumptions, not a live feed from Amazon. Verify current fees on Amazon's own seller pages before sourcing or pricing a product.
- ROI here follows the live calculator's definition (Net Profit divided by COGS plus inbound shipping) and does not represent a full business return after overhead, taxes, or financing.
- Advertising, returns, prep, aged inventory, inbound placement, disposal/removal, and other optional costs can materially change true profitability if left at their default zero values.
- The workbook models one product at a time; a multi-SKU portfolio means saving one copy per product.
- The file is a plain Excel workbook with no VBA or macros.
- It's built primarily for Microsoft Excel; Google Sheets compatibility is reasonable but not guaranteed identical for every formula and chart.
- Unauthorized resale or redistribution of the template file itself is not permitted.
Frequently Asked Questions
Is the Amazon FBA Profit Calculator template really free?
Yes. This is a free website download, Free Website Version v1.0, with no sign-up required.
How is this different from the online Amazon FBA Profit Calculator?
It's the offline, editable version of the same tool. The formulas match, including the ROI definition, so results reconcile between the two. The spreadsheet adds a Seller Plan Comparison table and an editable Price Sensitivity table that the quick browser version doesn't need to show.
Does the workbook use macros or VBA?
No. It's a plain .xlsx file with no macros, so it opens without a security warning.
Does it work in Google Sheets as well as Excel?
It's built primarily for Excel. The workbook notes reasonable Google Sheets compatibility, but some formulas or chart formatting may not render identically if opened in Sheets.
How is ROI calculated in this template?
ROI = Net Profit ÷ (COGS + Inbound Shipping), the same invested-capital definition used by the live calculator. It's a product-level planning metric, not a full business return after overhead, taxes, or financing.
Are the referral fee and fulfillment fee presets always accurate?
No, they're editable planning assumptions matching the examples on the live calculator page (15% Standard / 8% Electronics referral, $3.22 / $4.75 / $6.50 fulfillment), not a live feed from Amazon. Amazon's fees change, so re-check the current schedule before sourcing or pricing a product, and use the Custom option to enter your own current fees.
Can I compare the Professional and Individual selling plans for my own volume?
Yes. Enter your expected units per month and the Seller Plan Comparison table shows fee per unit, profit per unit, and monthly profit for both plans, plus the volume at which one plan's flat fee starts costing less than the other's per-item fee.
What's the difference between break-even price, price for target margin, and price for target ROI?
Break-even price is the floor below which the product loses money. Price for target margin is what it takes to hit the margin percentage you set. Price for target ROI is what it takes to hit the ROI percentage you set. All three are calculated from the same cost inputs, shown together.
Can I test what happens if I change my price?
Yes. The Price Sensitivity table recalculates profit per unit, net margin, and ROI at −10%, −5%, your current price, +5%, and +10%, and you can add your own rows for finer price steps.
Does this account for advertising, returns, or prep costs?
Yes, if you fill them in. Advertising and Returns/Other are entered as a percentage of sales, and Prep & Labeling and Other Per-Unit Costs are entered as flat per-unit amounts. All four default to zero, so leaving them blank will overstate your real profit if you actually incur these costs.
Is this financial or tax advice?
No. Results are estimates for business planning only and are not financial, tax, legal, or investment advice. Verify current Amazon fees and your own costs before making a sourcing or pricing decision.
What if I break a formula by accident?
Undo (Ctrl+Z) usually fixes an accidental overwrite if you catch it right away. Download a fresh copy of the template if a formula cell gets overwritten and you can't recover it.
Can I use this for more than one product?
Yes, but the sheet is built around one product's economics at a time. Save a separate copy of the file for each product you're evaluating rather than trying to track a full catalog on one sheet.
Is there a Premium or custom version of this template?
This free download is the standard website version. If you need multi-SKU comparison, additional fee modeling, or a custom Excel or Google Sheets template built around your own catalog, share your query and details at quote@dothecalculation.com and we'll send you a quote.